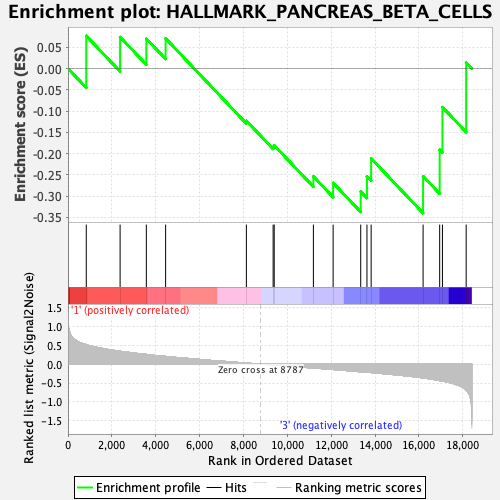
Profile of the Running ES Score & Positions of GeneSet Members on the Rank Ordered List
| Dataset | CLP.Basophil_Pheno.cls #Group2_versus_Group4.Basophil_Pheno.cls #Group2_versus_Group4_repos |
| Phenotype | Basophil_Pheno.cls#Group2_versus_Group4_repos |
| Upregulated in class | 3 |
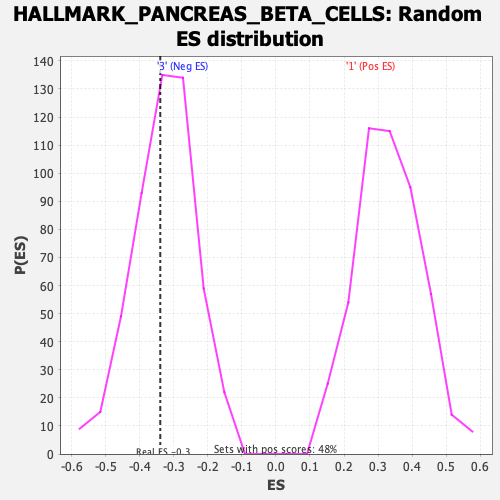
| GeneSet | HALLMARK_PANCREAS_BETA_CELLS |
| Enrichment Score (ES) | -0.3400353 |
| Normalized Enrichment Score (NES) | -1.0319738 |
| Nominal p-value | 0.40697673 |
| FDR q-value | 1.0 |
| FWER p-Value | 0.999 |
| SYMBOL | RANK IN GENE LIST | RANK METRIC SCORE | RUNNING ES | CORE ENRICHMENT | |
|---|---|---|---|---|---|
| 1 | Foxo1 | 833 | 0.514 | 0.0767 | No |
| 2 | Srprb | 2375 | 0.341 | 0.0739 | No |
| 3 | Vdr | 3571 | 0.258 | 0.0701 | No |
| 4 | Lmo2 | 4450 | 0.203 | 0.0707 | No |
| 5 | Dpp4 | 8131 | 0.027 | -0.1229 | No |
| 6 | Chga | 9351 | -0.022 | -0.1840 | No |
| 7 | Akt3 | 9400 | -0.024 | -0.1808 | No |
| 8 | Pak3 | 11186 | -0.102 | -0.2537 | No |
| 9 | Elp4 | 12086 | -0.141 | -0.2690 | No |
| 10 | Sec11a | 13344 | -0.202 | -0.2892 | Yes |
| 11 | Stxbp1 | 13628 | -0.215 | -0.2536 | Yes |
| 12 | Pklr | 13819 | -0.222 | -0.2113 | Yes |
| 13 | Gck | 16187 | -0.365 | -0.2533 | Yes |
| 14 | Srp14 | 16943 | -0.436 | -0.1908 | Yes |
| 15 | Spcs1 | 17069 | -0.449 | -0.0909 | Yes |
| 16 | Pcsk2 | 18151 | -0.689 | 0.0140 | Yes |