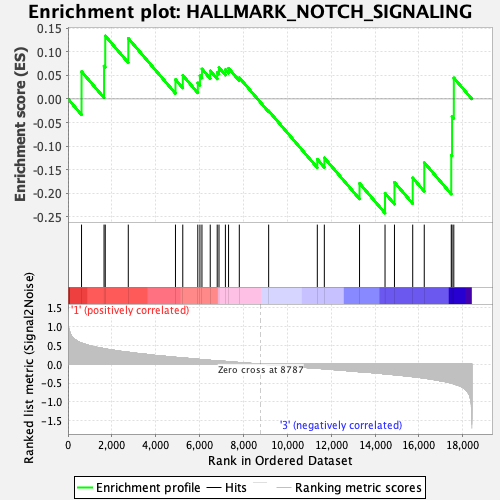
Profile of the Running ES Score & Positions of GeneSet Members on the Rank Ordered List
| Dataset | CLP.Basophil_Pheno.cls #Group2_versus_Group4.Basophil_Pheno.cls #Group2_versus_Group4_repos |
| Phenotype | Basophil_Pheno.cls#Group2_versus_Group4_repos |
| Upregulated in class | 3 |
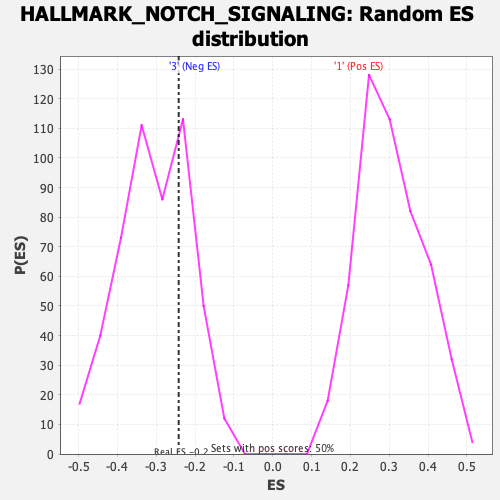
| GeneSet | HALLMARK_NOTCH_SIGNALING |
| Enrichment Score (ES) | -0.24217643 |
| Normalized Enrichment Score (NES) | -0.7935391 |
| Nominal p-value | 0.7370518 |
| FDR q-value | 0.91733056 |
| FWER p-Value | 1.0 |
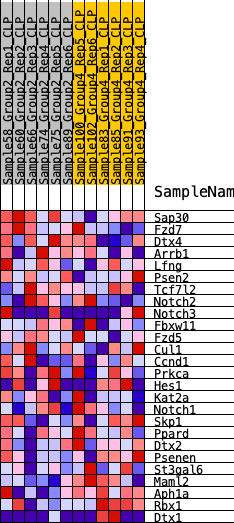
| SYMBOL | RANK IN GENE LIST | RANK METRIC SCORE | RUNNING ES | CORE ENRICHMENT | |
|---|---|---|---|---|---|
| 1 | Sap30 | 617 | 0.554 | 0.0581 | No |
| 2 | Fzd7 | 1643 | 0.408 | 0.0699 | No |
| 3 | Dtx4 | 1698 | 0.403 | 0.1337 | No |
| 4 | Arrb1 | 2748 | 0.314 | 0.1285 | No |
| 5 | Lfng | 4899 | 0.180 | 0.0413 | No |
| 6 | Psen2 | 5232 | 0.162 | 0.0500 | No |
| 7 | Tcf7l2 | 5917 | 0.128 | 0.0340 | No |
| 8 | Notch2 | 6014 | 0.123 | 0.0491 | No |
| 9 | Notch3 | 6106 | 0.118 | 0.0636 | No |
| 10 | Fbxw11 | 6484 | 0.099 | 0.0595 | No |
| 11 | Fzd5 | 6802 | 0.088 | 0.0568 | No |
| 12 | Cul1 | 6883 | 0.084 | 0.0663 | No |
| 13 | Ccnd1 | 7175 | 0.071 | 0.0623 | No |
| 14 | Prkca | 7319 | 0.064 | 0.0651 | No |
| 15 | Hes1 | 7809 | 0.041 | 0.0452 | No |
| 16 | Kat2a | 9147 | -0.014 | -0.0253 | No |
| 17 | Notch1 | 11365 | -0.109 | -0.1278 | No |
| 18 | Skp1 | 11685 | -0.123 | -0.1249 | No |
| 19 | Ppard | 13290 | -0.200 | -0.1790 | No |
| 20 | Dtx2 | 14452 | -0.256 | -0.1998 | Yes |
| 21 | Psenen | 14882 | -0.281 | -0.1767 | Yes |
| 22 | St3gal6 | 15714 | -0.330 | -0.1673 | Yes |
| 23 | Maml2 | 16240 | -0.368 | -0.1349 | Yes |
| 24 | Aph1a | 17471 | -0.500 | -0.1191 | Yes |
| 25 | Rbx1 | 17507 | -0.507 | -0.0371 | Yes |
| 26 | Dtx1 | 17587 | -0.520 | 0.0447 | Yes |