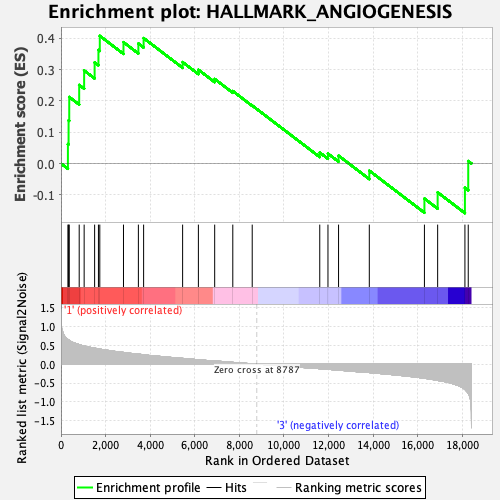
Profile of the Running ES Score & Positions of GeneSet Members on the Rank Ordered List
| Dataset | CLP.Basophil_Pheno.cls #Group2_versus_Group4.Basophil_Pheno.cls #Group2_versus_Group4_repos |
| Phenotype | Basophil_Pheno.cls#Group2_versus_Group4_repos |
| Upregulated in class | 1 |
| GeneSet | HALLMARK_ANGIOGENESIS |
| Enrichment Score (ES) | 0.40821818 |
| Normalized Enrichment Score (NES) | 1.2337822 |
| Nominal p-value | 0.21042085 |
| FDR q-value | 0.9651229 |
| FWER p-Value | 0.897 |
| SYMBOL | RANK IN GENE LIST | RANK METRIC SCORE | RUNNING ES | CORE ENRICHMENT | |
|---|---|---|---|---|---|
| 1 | Jag2 | 310 | 0.651 | 0.0621 | Yes |
| 2 | Olr1 | 340 | 0.639 | 0.1380 | Yes |
| 3 | Pf4 | 370 | 0.629 | 0.2127 | Yes |
| 4 | Ptk2 | 816 | 0.517 | 0.2512 | Yes |
| 5 | S100a4 | 1038 | 0.481 | 0.2975 | Yes |
| 6 | Apoh | 1508 | 0.423 | 0.3233 | Yes |
| 7 | Nrp1 | 1679 | 0.405 | 0.3631 | Yes |
| 8 | Pdgfa | 1740 | 0.399 | 0.4082 | Yes |
| 9 | Fgfr1 | 2802 | 0.309 | 0.3880 | No |
| 10 | Itgav | 3470 | 0.264 | 0.3837 | No |
| 11 | App | 3705 | 0.248 | 0.4010 | No |
| 12 | Lrpap1 | 5454 | 0.152 | 0.3243 | No |
| 13 | Vcan | 6161 | 0.115 | 0.2999 | No |
| 14 | Vav2 | 6892 | 0.084 | 0.2703 | No |
| 15 | Thbd | 7704 | 0.046 | 0.2317 | No |
| 16 | Spp1 | 8575 | 0.008 | 0.1854 | No |
| 17 | Postn | 11604 | -0.119 | 0.0351 | No |
| 18 | Fstl1 | 11972 | -0.136 | 0.0317 | No |
| 19 | Ccnd2 | 12447 | -0.158 | 0.0251 | No |
| 20 | Vegfa | 13826 | -0.222 | -0.0229 | No |
| 21 | Tnfrsf21 | 16298 | -0.373 | -0.1121 | No |
| 22 | Pglyrp1 | 16891 | -0.430 | -0.0922 | No |
| 23 | Slco2a1 | 18114 | -0.669 | -0.0775 | No |
| 24 | Prg2 | 18263 | -0.770 | 0.0079 | No |

