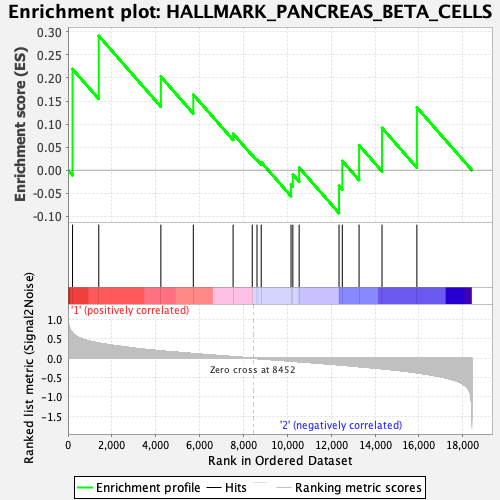
Profile of the Running ES Score & Positions of GeneSet Members on the Rank Ordered List
| Dataset | CLP.Basophil_Pheno.cls #Group2_versus_Group3.Basophil_Pheno.cls #Group2_versus_Group3_repos |
| Phenotype | Basophil_Pheno.cls#Group2_versus_Group3_repos |
| Upregulated in class | 1 |
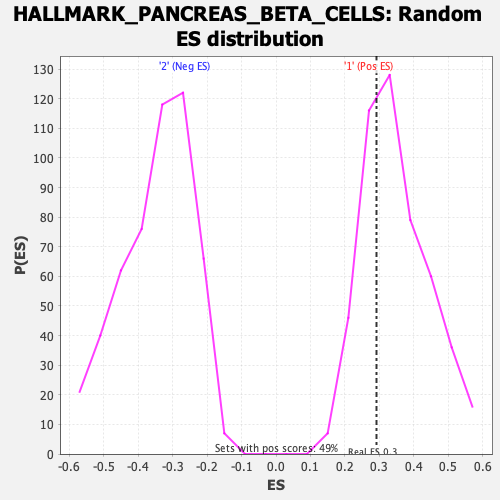
| GeneSet | HALLMARK_PANCREAS_BETA_CELLS |
| Enrichment Score (ES) | 0.29138333 |
| Normalized Enrichment Score (NES) | 0.8395908 |
| Nominal p-value | 0.6946721 |
| FDR q-value | 0.9583292 |
| FWER p-Value | 1.0 |
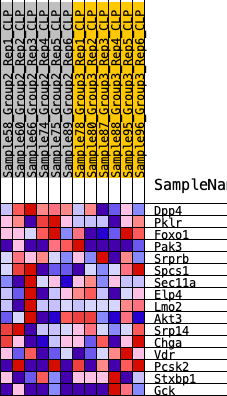
| SYMBOL | RANK IN GENE LIST | RANK METRIC SCORE | RUNNING ES | CORE ENRICHMENT | |
|---|---|---|---|---|---|
| 1 | Dpp4 | 207 | 0.656 | 0.2194 | Yes |
| 2 | Pklr | 1403 | 0.389 | 0.2914 | Yes |
| 3 | Foxo1 | 4233 | 0.187 | 0.2032 | No |
| 4 | Pak3 | 5712 | 0.117 | 0.1639 | No |
| 5 | Srprb | 7526 | 0.039 | 0.0791 | No |
| 6 | Spcs1 | 8399 | 0.002 | 0.0323 | No |
| 7 | Sec11a | 8616 | -0.006 | 0.0228 | No |
| 8 | Elp4 | 8808 | -0.014 | 0.0173 | No |
| 9 | Lmo2 | 10167 | -0.071 | -0.0316 | No |
| 10 | Akt3 | 10250 | -0.075 | -0.0098 | No |
| 11 | Srp14 | 10538 | -0.087 | 0.0054 | No |
| 12 | Chga | 12355 | -0.169 | -0.0340 | No |
| 13 | Vdr | 12504 | -0.176 | 0.0199 | No |
| 14 | Pcsk2 | 13269 | -0.215 | 0.0540 | No |
| 15 | Stxbp1 | 14315 | -0.269 | 0.0916 | No |
| 16 | Gck | 15904 | -0.372 | 0.1361 | No |