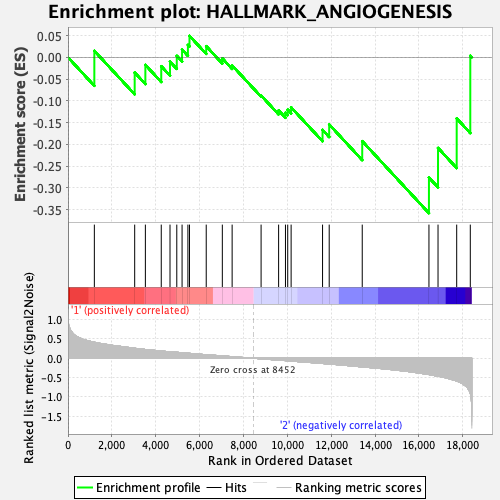
Profile of the Running ES Score & Positions of GeneSet Members on the Rank Ordered List
| Dataset | CLP.Basophil_Pheno.cls #Group2_versus_Group3.Basophil_Pheno.cls #Group2_versus_Group3_repos |
| Phenotype | Basophil_Pheno.cls#Group2_versus_Group3_repos |
| Upregulated in class | 2 |
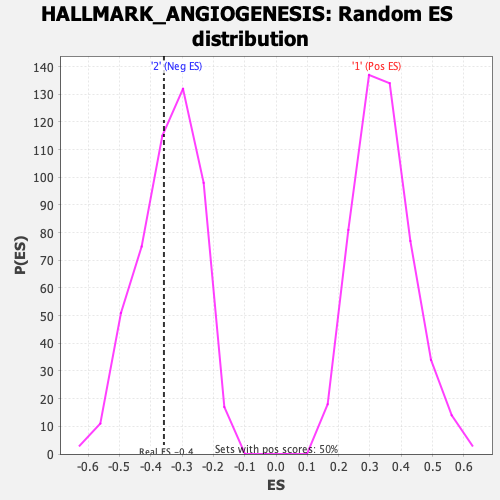
| GeneSet | HALLMARK_ANGIOGENESIS |
| Enrichment Score (ES) | -0.3579583 |
| Normalized Enrichment Score (NES) | -1.0427759 |
| Nominal p-value | 0.42828685 |
| FDR q-value | 1.0 |
| FWER p-Value | 0.984 |
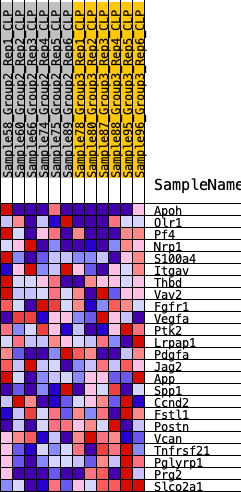
| SYMBOL | RANK IN GENE LIST | RANK METRIC SCORE | RUNNING ES | CORE ENRICHMENT | |
|---|---|---|---|---|---|
| 1 | Apoh | 1201 | 0.412 | 0.0150 | No |
| 2 | Olr1 | 3040 | 0.257 | -0.0349 | No |
| 3 | Pf4 | 3527 | 0.226 | -0.0173 | No |
| 4 | Nrp1 | 4251 | 0.186 | -0.0204 | No |
| 5 | S100a4 | 4650 | 0.166 | -0.0097 | No |
| 6 | Itgav | 4959 | 0.153 | 0.0034 | No |
| 7 | Thbd | 5200 | 0.142 | 0.0181 | No |
| 8 | Vav2 | 5466 | 0.129 | 0.0288 | No |
| 9 | Fgfr1 | 5538 | 0.126 | 0.0494 | No |
| 10 | Vegfa | 6301 | 0.091 | 0.0257 | No |
| 11 | Ptk2 | 7035 | 0.061 | -0.0023 | No |
| 12 | Lrpap1 | 7482 | 0.041 | -0.0186 | No |
| 13 | Pdgfa | 8802 | -0.014 | -0.0876 | No |
| 14 | Jag2 | 9601 | -0.047 | -0.1219 | No |
| 15 | App | 9913 | -0.060 | -0.1272 | No |
| 16 | Spp1 | 10016 | -0.064 | -0.1203 | No |
| 17 | Ccnd2 | 10171 | -0.071 | -0.1149 | No |
| 18 | Fstl1 | 11604 | -0.134 | -0.1666 | No |
| 19 | Postn | 11907 | -0.148 | -0.1542 | No |
| 20 | Vcan | 13413 | -0.223 | -0.1926 | No |
| 21 | Tnfrsf21 | 16454 | -0.420 | -0.2762 | Yes |
| 22 | Pglyrp1 | 16868 | -0.465 | -0.2081 | Yes |
| 23 | Prg2 | 17719 | -0.586 | -0.1403 | Yes |
| 24 | Slco2a1 | 18339 | -0.912 | 0.0038 | Yes |