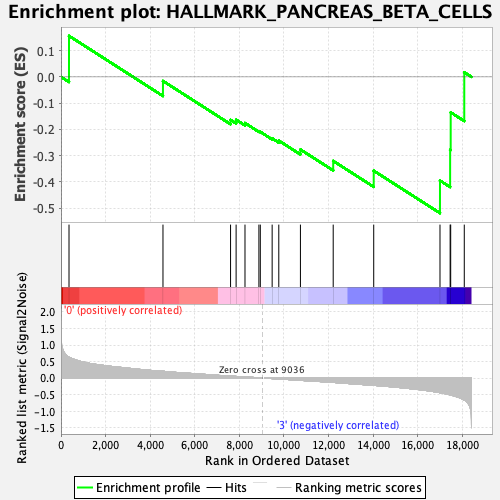
Profile of the Running ES Score & Positions of GeneSet Members on the Rank Ordered List
| Dataset | CLP.Basophil_Pheno.cls #Group1_versus_Group4.Basophil_Pheno.cls #Group1_versus_Group4_repos |
| Phenotype | Basophil_Pheno.cls#Group1_versus_Group4_repos |
| Upregulated in class | 3 |
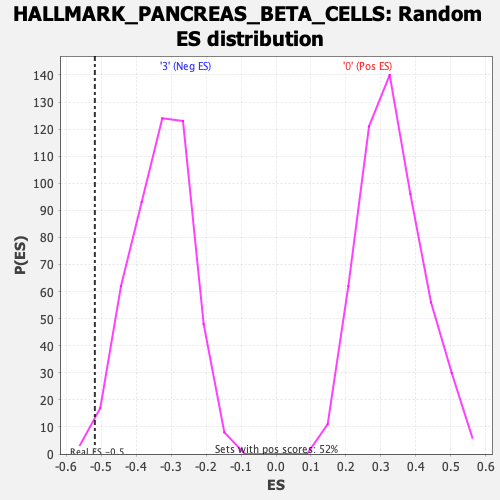
| GeneSet | HALLMARK_PANCREAS_BETA_CELLS |
| Enrichment Score (ES) | -0.51866364 |
| Normalized Enrichment Score (NES) | -1.5663335 |
| Nominal p-value | 0.0062761507 |
| FDR q-value | 0.28893918 |
| FWER p-Value | 0.267 |
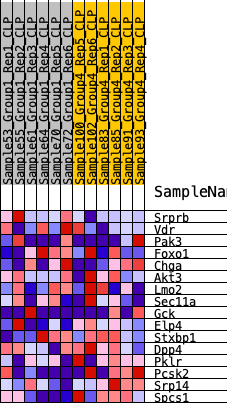
| SYMBOL | RANK IN GENE LIST | RANK METRIC SCORE | RUNNING ES | CORE ENRICHMENT | |
|---|---|---|---|---|---|
| 1 | Srprb | 359 | 0.628 | 0.1562 | No |
| 2 | Vdr | 4573 | 0.205 | -0.0155 | No |
| 3 | Pak3 | 7604 | 0.059 | -0.1636 | No |
| 4 | Foxo1 | 7853 | 0.049 | -0.1633 | No |
| 5 | Chga | 8251 | 0.033 | -0.1756 | No |
| 6 | Akt3 | 8875 | 0.008 | -0.2073 | No |
| 7 | Lmo2 | 8938 | 0.005 | -0.2092 | No |
| 8 | Sec11a | 9469 | -0.015 | -0.2339 | No |
| 9 | Gck | 9767 | -0.027 | -0.2427 | No |
| 10 | Elp4 | 10737 | -0.068 | -0.2764 | No |
| 11 | Stxbp1 | 12207 | -0.130 | -0.3199 | No |
| 12 | Dpp4 | 14024 | -0.220 | -0.3571 | No |
| 13 | Pklr | 16996 | -0.443 | -0.3947 | Yes |
| 14 | Pcsk2 | 17451 | -0.507 | -0.2775 | Yes |
| 15 | Srp14 | 17476 | -0.513 | -0.1351 | Yes |
| 16 | Spcs1 | 18085 | -0.664 | 0.0176 | Yes |