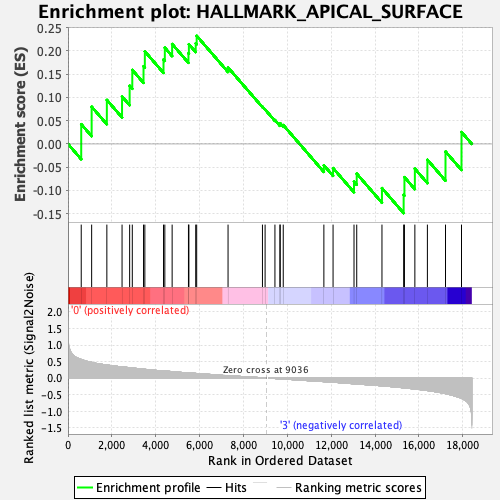
Profile of the Running ES Score & Positions of GeneSet Members on the Rank Ordered List
| Dataset | CLP.Basophil_Pheno.cls #Group1_versus_Group4.Basophil_Pheno.cls #Group1_versus_Group4_repos |
| Phenotype | Basophil_Pheno.cls#Group1_versus_Group4_repos |
| Upregulated in class | 0 |
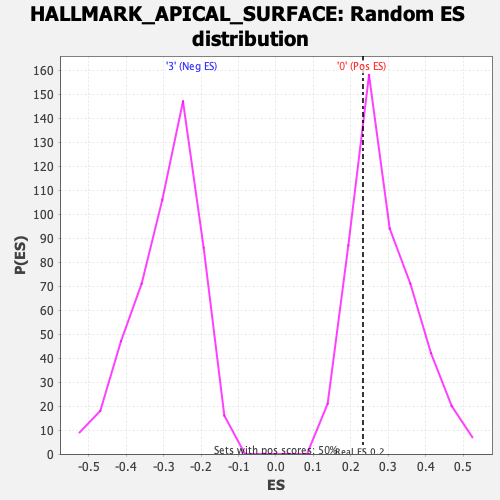
| GeneSet | HALLMARK_APICAL_SURFACE |
| Enrichment Score (ES) | 0.2323634 |
| Normalized Enrichment Score (NES) | 0.8133445 |
| Nominal p-value | 0.698 |
| FDR q-value | 1.0 |
| FWER p-Value | 1.0 |
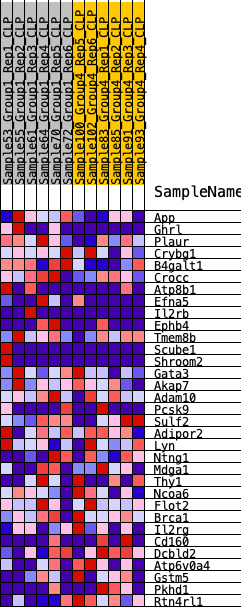
| SYMBOL | RANK IN GENE LIST | RANK METRIC SCORE | RUNNING ES | CORE ENRICHMENT | |
|---|---|---|---|---|---|
| 1 | App | 603 | 0.564 | 0.0424 | Yes |
| 2 | Ghrl | 1078 | 0.474 | 0.0800 | Yes |
| 3 | Plaur | 1771 | 0.392 | 0.0946 | Yes |
| 4 | Crybg1 | 2464 | 0.337 | 0.1019 | Yes |
| 5 | B4galt1 | 2810 | 0.314 | 0.1251 | Yes |
| 6 | Crocc | 2931 | 0.304 | 0.1591 | Yes |
| 7 | Atp8b1 | 3443 | 0.267 | 0.1670 | Yes |
| 8 | Efna5 | 3503 | 0.263 | 0.1990 | Yes |
| 9 | Il2rb | 4354 | 0.216 | 0.1816 | Yes |
| 10 | Ephb4 | 4414 | 0.214 | 0.2069 | Yes |
| 11 | Tmem8b | 4747 | 0.195 | 0.2148 | Yes |
| 12 | Scube1 | 5491 | 0.154 | 0.1949 | Yes |
| 13 | Shroom2 | 5511 | 0.154 | 0.2144 | Yes |
| 14 | Gata3 | 5822 | 0.140 | 0.2162 | Yes |
| 15 | Akap7 | 5866 | 0.138 | 0.2324 | Yes |
| 16 | Adam10 | 7296 | 0.073 | 0.1643 | No |
| 17 | Pcsk9 | 8864 | 0.008 | 0.0801 | No |
| 18 | Sulf2 | 8985 | 0.003 | 0.0739 | No |
| 19 | Adipor2 | 9433 | -0.013 | 0.0514 | No |
| 20 | Lyn | 9662 | -0.022 | 0.0419 | No |
| 21 | Ntng1 | 9672 | -0.022 | 0.0444 | No |
| 22 | Mdga1 | 9812 | -0.028 | 0.0406 | No |
| 23 | Thy1 | 11664 | -0.107 | -0.0459 | No |
| 24 | Ncoa6 | 12083 | -0.125 | -0.0519 | No |
| 25 | Flot2 | 13038 | -0.171 | -0.0809 | No |
| 26 | Brca1 | 13162 | -0.178 | -0.0639 | No |
| 27 | Il2rg | 14312 | -0.236 | -0.0949 | No |
| 28 | Cd160 | 15301 | -0.295 | -0.1093 | No |
| 29 | Dcbld2 | 15337 | -0.298 | -0.0714 | No |
| 30 | Atp6v0a4 | 15812 | -0.330 | -0.0532 | No |
| 31 | Gstm5 | 16383 | -0.376 | -0.0340 | No |
| 32 | Pkhd1 | 17209 | -0.469 | -0.0163 | No |
| 33 | Rtn4rl1 | 17938 | -0.611 | 0.0256 | No |