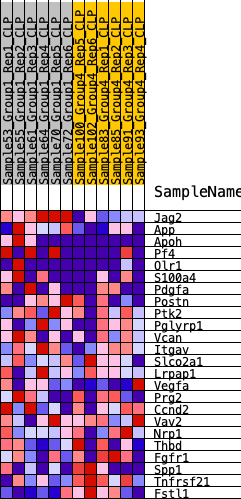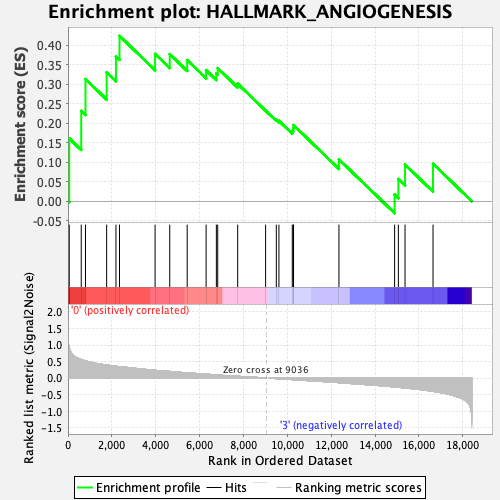
Profile of the Running ES Score & Positions of GeneSet Members on the Rank Ordered List
| Dataset | CLP.Basophil_Pheno.cls #Group1_versus_Group4.Basophil_Pheno.cls #Group1_versus_Group4_repos |
| Phenotype | Basophil_Pheno.cls#Group1_versus_Group4_repos |
| Upregulated in class | 0 |
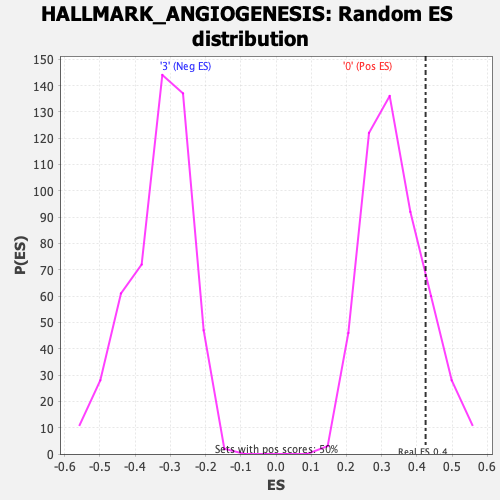
| GeneSet | HALLMARK_ANGIOGENESIS |
| Enrichment Score (ES) | 0.42463827 |
| Normalized Enrichment Score (NES) | 1.2608685 |
| Nominal p-value | 0.17068273 |
| FDR q-value | 1.0 |
| FWER p-Value | 0.89 |
| SYMBOL | RANK IN GENE LIST | RANK METRIC SCORE | RUNNING ES | CORE ENRICHMENT | |
|---|---|---|---|---|---|
| 1 | Jag2 | 56 | 0.925 | 0.1615 | Yes |
| 2 | App | 603 | 0.564 | 0.2320 | Yes |
| 3 | Apoh | 797 | 0.517 | 0.3136 | Yes |
| 4 | Pf4 | 1762 | 0.393 | 0.3311 | Yes |
| 5 | Olr1 | 2186 | 0.359 | 0.3719 | Yes |
| 6 | S100a4 | 2348 | 0.345 | 0.4246 | Yes |
| 7 | Pdgfa | 3970 | 0.235 | 0.3783 | No |
| 8 | Postn | 4638 | 0.201 | 0.3778 | No |
| 9 | Ptk2 | 5433 | 0.157 | 0.3625 | No |
| 10 | Pglyrp1 | 6296 | 0.118 | 0.3366 | No |
| 11 | Vcan | 6763 | 0.096 | 0.3283 | No |
| 12 | Itgav | 6825 | 0.093 | 0.3416 | No |
| 13 | Slco2a1 | 7735 | 0.054 | 0.3019 | No |
| 14 | Lrpap1 | 9008 | 0.001 | 0.2329 | No |
| 15 | Vegfa | 9496 | -0.016 | 0.2092 | No |
| 16 | Prg2 | 9615 | -0.020 | 0.2064 | No |
| 17 | Ccnd2 | 10224 | -0.046 | 0.1815 | No |
| 18 | Vav2 | 10271 | -0.048 | 0.1874 | No |
| 19 | Nrp1 | 10281 | -0.048 | 0.1955 | No |
| 20 | Thbd | 12351 | -0.138 | 0.1074 | No |
| 21 | Fgfr1 | 14889 | -0.269 | 0.0172 | No |
| 22 | Spp1 | 15060 | -0.276 | 0.0572 | No |
| 23 | Tnfrsf21 | 15364 | -0.300 | 0.0941 | No |
| 24 | Fstl1 | 16640 | -0.401 | 0.0962 | No |