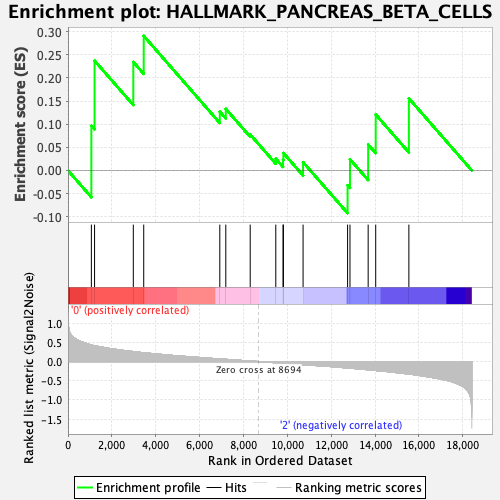
Profile of the Running ES Score & Positions of GeneSet Members on the Rank Ordered List
| Dataset | CLP.Basophil_Pheno.cls #Group1_versus_Group3.Basophil_Pheno.cls #Group1_versus_Group3_repos |
| Phenotype | Basophil_Pheno.cls#Group1_versus_Group3_repos |
| Upregulated in class | 0 |
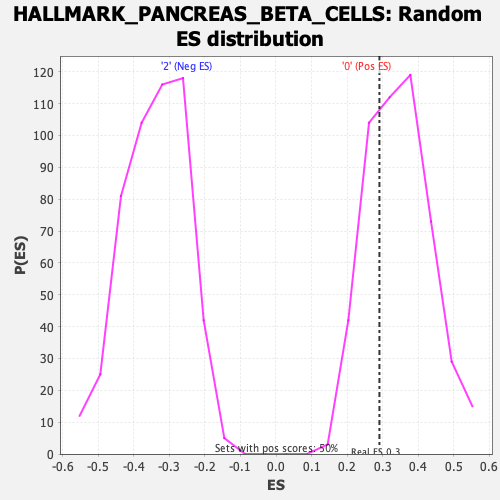
| GeneSet | HALLMARK_PANCREAS_BETA_CELLS |
| Enrichment Score (ES) | 0.2911569 |
| Normalized Enrichment Score (NES) | 0.84488887 |
| Nominal p-value | 0.694165 |
| FDR q-value | 1.0 |
| FWER p-Value | 1.0 |
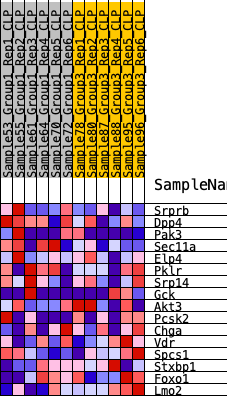
| SYMBOL | RANK IN GENE LIST | RANK METRIC SCORE | RUNNING ES | CORE ENRICHMENT | |
|---|---|---|---|---|---|
| 1 | Srprb | 1065 | 0.429 | 0.0968 | Yes |
| 2 | Dpp4 | 1211 | 0.412 | 0.2375 | Yes |
| 3 | Pak3 | 2977 | 0.258 | 0.2347 | Yes |
| 4 | Sec11a | 3452 | 0.228 | 0.2912 | Yes |
| 5 | Elp4 | 6920 | 0.068 | 0.1272 | No |
| 6 | Pklr | 7193 | 0.058 | 0.1332 | No |
| 7 | Srp14 | 8306 | 0.014 | 0.0778 | No |
| 8 | Gck | 9472 | -0.030 | 0.0254 | No |
| 9 | Akt3 | 9802 | -0.043 | 0.0230 | No |
| 10 | Pcsk2 | 9820 | -0.043 | 0.0377 | No |
| 11 | Chga | 10716 | -0.080 | 0.0179 | No |
| 12 | Vdr | 12745 | -0.168 | -0.0319 | No |
| 13 | Spcs1 | 12854 | -0.172 | 0.0243 | No |
| 14 | Stxbp1 | 13683 | -0.213 | 0.0560 | No |
| 15 | Foxo1 | 14027 | -0.232 | 0.1210 | No |
| 16 | Lmo2 | 15539 | -0.325 | 0.1560 | No |