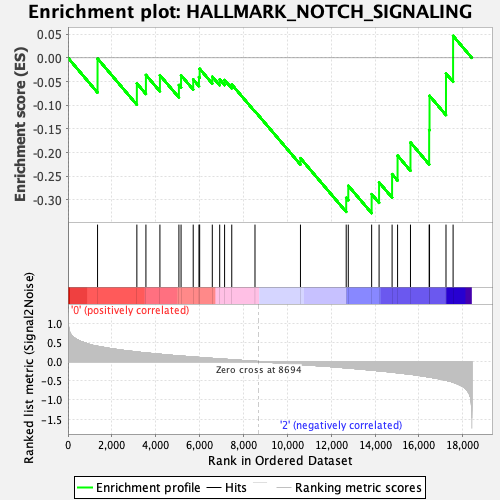
Profile of the Running ES Score & Positions of GeneSet Members on the Rank Ordered List
| Dataset | CLP.Basophil_Pheno.cls #Group1_versus_Group3.Basophil_Pheno.cls #Group1_versus_Group3_repos |
| Phenotype | Basophil_Pheno.cls#Group1_versus_Group3_repos |
| Upregulated in class | 2 |
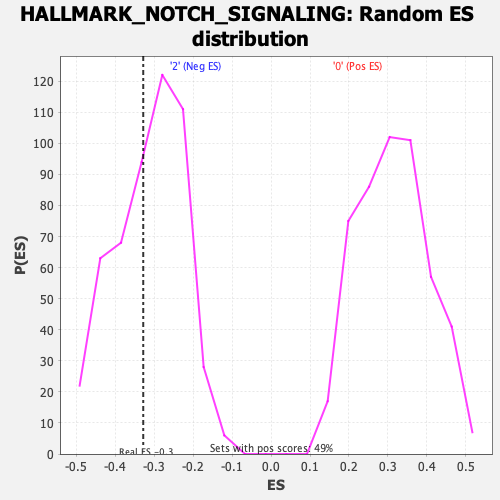
| GeneSet | HALLMARK_NOTCH_SIGNALING |
| Enrichment Score (ES) | -0.32784033 |
| Normalized Enrichment Score (NES) | -1.0525553 |
| Nominal p-value | 0.3929961 |
| FDR q-value | 0.66903573 |
| FWER p-Value | 0.984 |
| SYMBOL | RANK IN GENE LIST | RANK METRIC SCORE | RUNNING ES | CORE ENRICHMENT | |
|---|---|---|---|---|---|
| 1 | Fzd5 | 1347 | 0.396 | -0.0015 | No |
| 2 | Notch2 | 3139 | 0.249 | -0.0539 | No |
| 3 | Notch3 | 3552 | 0.222 | -0.0361 | No |
| 4 | Cul1 | 4190 | 0.188 | -0.0367 | No |
| 5 | Psen2 | 5056 | 0.146 | -0.0573 | No |
| 6 | Kat2a | 5154 | 0.142 | -0.0369 | No |
| 7 | St3gal6 | 5708 | 0.118 | -0.0456 | No |
| 8 | Arrb1 | 5971 | 0.107 | -0.0405 | No |
| 9 | Fbxw11 | 6002 | 0.105 | -0.0231 | No |
| 10 | Sap30 | 6578 | 0.081 | -0.0397 | No |
| 11 | Hes1 | 6915 | 0.068 | -0.0456 | No |
| 12 | Dtx4 | 7138 | 0.060 | -0.0468 | No |
| 13 | Skp1 | 7465 | 0.046 | -0.0562 | No |
| 14 | Aph1a | 8524 | 0.006 | -0.1127 | No |
| 15 | Lfng | 10597 | -0.075 | -0.2118 | No |
| 16 | Rbx1 | 12682 | -0.164 | -0.2954 | Yes |
| 17 | Dtx2 | 12777 | -0.169 | -0.2700 | Yes |
| 18 | Notch1 | 13842 | -0.221 | -0.2877 | Yes |
| 19 | Prkca | 14181 | -0.239 | -0.2629 | Yes |
| 20 | Tcf7l2 | 14774 | -0.274 | -0.2455 | Yes |
| 21 | Fzd7 | 15024 | -0.291 | -0.2064 | Yes |
| 22 | Ccnd1 | 15612 | -0.330 | -0.1786 | Yes |
| 23 | Ppard | 16464 | -0.401 | -0.1522 | Yes |
| 24 | Psenen | 16481 | -0.403 | -0.0801 | Yes |
| 25 | Dtx1 | 17231 | -0.485 | -0.0330 | Yes |
| 26 | Maml2 | 17555 | -0.536 | 0.0464 | Yes |