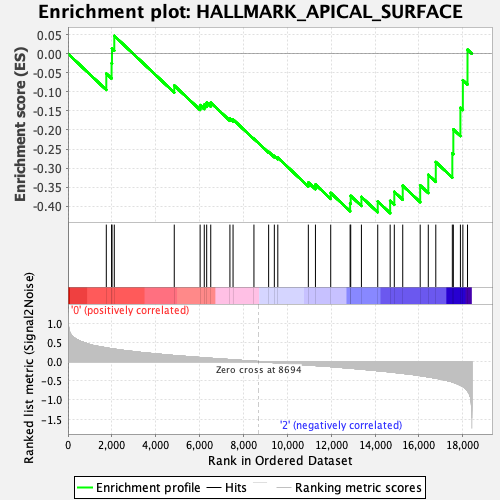
Profile of the Running ES Score & Positions of GeneSet Members on the Rank Ordered List
| Dataset | CLP.Basophil_Pheno.cls #Group1_versus_Group3.Basophil_Pheno.cls #Group1_versus_Group3_repos |
| Phenotype | Basophil_Pheno.cls#Group1_versus_Group3_repos |
| Upregulated in class | 2 |
| GeneSet | HALLMARK_APICAL_SURFACE |
| Enrichment Score (ES) | -0.41807383 |
| Normalized Enrichment Score (NES) | -1.2186596 |
| Nominal p-value | 0.21146245 |
| FDR q-value | 0.9760084 |
| FWER p-Value | 0.897 |
| SYMBOL | RANK IN GENE LIST | RANK METRIC SCORE | RUNNING ES | CORE ENRICHMENT | |
|---|---|---|---|---|---|
| 1 | Pcsk9 | 1746 | 0.355 | -0.0521 | No |
| 2 | Lyn | 1987 | 0.330 | -0.0253 | No |
| 3 | Ghrl | 2005 | 0.329 | 0.0135 | No |
| 4 | Brca1 | 2110 | 0.322 | 0.0467 | No |
| 5 | Ncoa6 | 4844 | 0.154 | -0.0834 | No |
| 6 | App | 6023 | 0.105 | -0.1349 | No |
| 7 | Adam10 | 6212 | 0.096 | -0.1335 | No |
| 8 | Akap7 | 6322 | 0.091 | -0.1285 | No |
| 9 | Crybg1 | 6507 | 0.083 | -0.1284 | No |
| 10 | Plaur | 7381 | 0.050 | -0.1699 | No |
| 11 | Tmem8b | 7524 | 0.044 | -0.1723 | No |
| 12 | Efna5 | 8476 | 0.007 | -0.2232 | No |
| 13 | Atp6v0a4 | 9146 | -0.018 | -0.2574 | No |
| 14 | B4galt1 | 9406 | -0.028 | -0.2681 | No |
| 15 | Ntng1 | 9564 | -0.034 | -0.2726 | No |
| 16 | Adipor2 | 10956 | -0.088 | -0.3377 | No |
| 17 | Crocc | 11280 | -0.103 | -0.3429 | No |
| 18 | Ephb4 | 11976 | -0.130 | -0.3649 | No |
| 19 | Mdga1 | 12861 | -0.172 | -0.3922 | Yes |
| 20 | Gata3 | 12888 | -0.174 | -0.3727 | Yes |
| 21 | Cd160 | 13376 | -0.197 | -0.3754 | Yes |
| 22 | Sulf2 | 14119 | -0.236 | -0.3873 | Yes |
| 23 | Flot2 | 14686 | -0.268 | -0.3858 | Yes |
| 24 | Scube1 | 14875 | -0.282 | -0.3620 | Yes |
| 25 | Dcbld2 | 15259 | -0.305 | -0.3460 | Yes |
| 26 | Il2rg | 16055 | -0.365 | -0.3453 | Yes |
| 27 | Pkhd1 | 16424 | -0.397 | -0.3174 | Yes |
| 28 | Shroom2 | 16766 | -0.431 | -0.2840 | Yes |
| 29 | Atp8b1 | 17520 | -0.529 | -0.2611 | Yes |
| 30 | Gstm5 | 17566 | -0.539 | -0.1985 | Yes |
| 31 | Rtn4rl1 | 17888 | -0.615 | -0.1417 | Yes |
| 32 | Thy1 | 18000 | -0.648 | -0.0695 | Yes |
| 33 | Il2rb | 18212 | -0.759 | 0.0107 | Yes |

