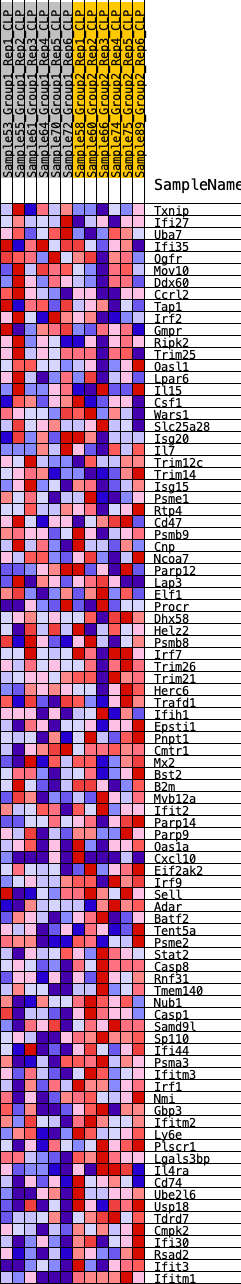
Profile of the Running ES Score & Positions of GeneSet Members on the Rank Ordered List
| Dataset | CLP.Basophil_Pheno.cls #Group1_versus_Group2.Basophil_Pheno.cls #Group1_versus_Group2_repos |
| Phenotype | Basophil_Pheno.cls#Group1_versus_Group2_repos |
| Upregulated in class | 1 |
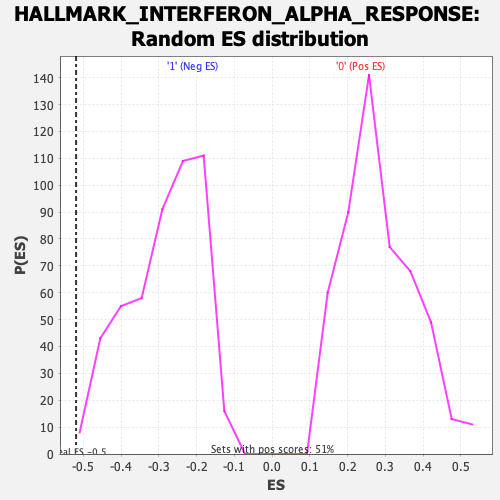
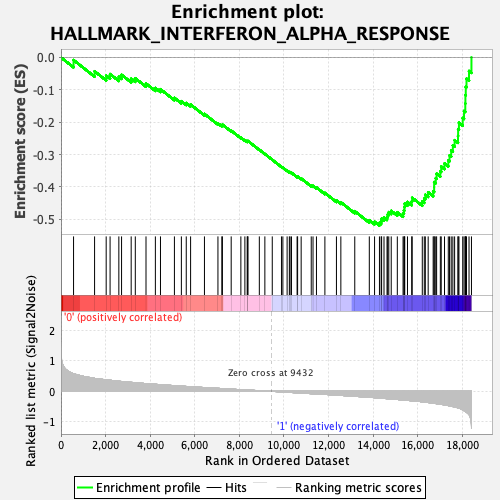
| GeneSet | HALLMARK_INTERFERON_ALPHA_RESPONSE |
| Enrichment Score (ES) | -0.5193954 |
| Normalized Enrichment Score (NES) | -1.822946 |
| Nominal p-value | 0.00814664 |
| FDR q-value | 0.063315146 |
| FWER p-Value | 0.031 |
| SYMBOL | RANK IN GENE LIST | RANK METRIC SCORE | RUNNING ES | CORE ENRICHMENT | |
|---|---|---|---|---|---|
| 1 | Txnip | 563 | 0.576 | -0.0081 | No |
| 2 | Ifi27 | 1506 | 0.424 | -0.0428 | No |
| 3 | Uba7 | 2026 | 0.379 | -0.0562 | No |
| 4 | Ifi35 | 2201 | 0.364 | -0.0514 | No |
| 5 | Ogfr | 2594 | 0.331 | -0.0598 | No |
| 6 | Mov10 | 2716 | 0.323 | -0.0536 | No |
| 7 | Ddx60 | 3147 | 0.295 | -0.0655 | No |
| 8 | Ccrl2 | 3332 | 0.284 | -0.0644 | No |
| 9 | Tap1 | 3812 | 0.253 | -0.0806 | No |
| 10 | Irf2 | 4232 | 0.231 | -0.0944 | No |
| 11 | Gmpr | 4461 | 0.219 | -0.0982 | No |
| 12 | Ripk2 | 5086 | 0.186 | -0.1249 | No |
| 13 | Trim25 | 5398 | 0.170 | -0.1352 | No |
| 14 | Oasl1 | 5617 | 0.160 | -0.1408 | No |
| 15 | Lpar6 | 5812 | 0.150 | -0.1455 | No |
| 16 | Il15 | 6433 | 0.122 | -0.1745 | No |
| 17 | Csf1 | 7038 | 0.097 | -0.2036 | No |
| 18 | Wars1 | 7213 | 0.089 | -0.2096 | No |
| 19 | Slc25a28 | 7238 | 0.088 | -0.2075 | No |
| 20 | Isg20 | 7632 | 0.071 | -0.2261 | No |
| 21 | Il7 | 8066 | 0.054 | -0.2476 | No |
| 22 | Trim12c | 8246 | 0.046 | -0.2556 | No |
| 23 | Trim14 | 8350 | 0.043 | -0.2595 | No |
| 24 | Isg15 | 8372 | 0.042 | -0.2590 | No |
| 25 | Psme1 | 8382 | 0.041 | -0.2579 | No |
| 26 | Rtp4 | 8894 | 0.021 | -0.2850 | No |
| 27 | Cd47 | 9142 | 0.011 | -0.2980 | No |
| 28 | Psmb9 | 9474 | -0.001 | -0.3160 | No |
| 29 | Cnp | 9887 | -0.017 | -0.3379 | No |
| 30 | Ncoa7 | 9950 | -0.019 | -0.3405 | No |
| 31 | Parp12 | 10140 | -0.027 | -0.3497 | No |
| 32 | Lap3 | 10240 | -0.032 | -0.3539 | No |
| 33 | Elf1 | 10273 | -0.033 | -0.3543 | No |
| 34 | Procr | 10336 | -0.036 | -0.3563 | No |
| 35 | Dhx58 | 10588 | -0.048 | -0.3681 | No |
| 36 | Helz2 | 10611 | -0.049 | -0.3674 | No |
| 37 | Psmb8 | 10770 | -0.056 | -0.3738 | No |
| 38 | Irf7 | 11222 | -0.075 | -0.3955 | No |
| 39 | Trim26 | 11302 | -0.078 | -0.3967 | No |
| 40 | Trim21 | 11456 | -0.085 | -0.4017 | No |
| 41 | Herc6 | 11834 | -0.099 | -0.4184 | No |
| 42 | Trafd1 | 12352 | -0.123 | -0.4418 | No |
| 43 | Ifih1 | 12550 | -0.132 | -0.4473 | No |
| 44 | Epsti1 | 13174 | -0.162 | -0.4749 | No |
| 45 | Pnpt1 | 13826 | -0.195 | -0.5028 | No |
| 46 | Cmtr1 | 14062 | -0.207 | -0.5075 | No |
| 47 | Mx2 | 14281 | -0.221 | -0.5107 | Yes |
| 48 | Bst2 | 14357 | -0.225 | -0.5060 | Yes |
| 49 | B2m | 14378 | -0.226 | -0.4982 | Yes |
| 50 | Mvb12a | 14485 | -0.233 | -0.4948 | Yes |
| 51 | Ifit2 | 14621 | -0.239 | -0.4927 | Yes |
| 52 | Parp14 | 14652 | -0.241 | -0.4849 | Yes |
| 53 | Parp9 | 14700 | -0.244 | -0.4779 | Yes |
| 54 | Oas1a | 14809 | -0.251 | -0.4739 | Yes |
| 55 | Cxcl10 | 15082 | -0.266 | -0.4782 | Yes |
| 56 | Eif2ak2 | 15340 | -0.281 | -0.4812 | Yes |
| 57 | Irf9 | 15379 | -0.284 | -0.4721 | Yes |
| 58 | Sell | 15401 | -0.286 | -0.4620 | Yes |
| 59 | Adar | 15415 | -0.287 | -0.4514 | Yes |
| 60 | Batf2 | 15538 | -0.296 | -0.4464 | Yes |
| 61 | Tent5a | 15728 | -0.309 | -0.4446 | Yes |
| 62 | Psme2 | 15748 | -0.310 | -0.4334 | Yes |
| 63 | Stat2 | 16202 | -0.344 | -0.4446 | Yes |
| 64 | Casp8 | 16291 | -0.352 | -0.4355 | Yes |
| 65 | Rnf31 | 16338 | -0.356 | -0.4240 | Yes |
| 66 | Tmem140 | 16466 | -0.367 | -0.4165 | Yes |
| 67 | Nub1 | 16690 | -0.388 | -0.4134 | Yes |
| 68 | Casp1 | 16734 | -0.392 | -0.4003 | Yes |
| 69 | Samd9l | 16735 | -0.392 | -0.3849 | Yes |
| 70 | Sp110 | 16806 | -0.400 | -0.3730 | Yes |
| 71 | Ifi44 | 16845 | -0.405 | -0.3591 | Yes |
| 72 | Psma3 | 17011 | -0.421 | -0.3515 | Yes |
| 73 | Ifitm3 | 17051 | -0.426 | -0.3369 | Yes |
| 74 | Irf1 | 17199 | -0.445 | -0.3274 | Yes |
| 75 | Nmi | 17368 | -0.468 | -0.3182 | Yes |
| 76 | Gbp3 | 17424 | -0.476 | -0.3024 | Yes |
| 77 | Ifitm2 | 17499 | -0.489 | -0.2872 | Yes |
| 78 | Ly6e | 17573 | -0.500 | -0.2715 | Yes |
| 79 | Plscr1 | 17652 | -0.512 | -0.2556 | Yes |
| 80 | Lgals3bp | 17804 | -0.541 | -0.2426 | Yes |
| 81 | Il4ra | 17810 | -0.543 | -0.2215 | Yes |
| 82 | Cd74 | 17846 | -0.551 | -0.2017 | Yes |
| 83 | Ube2l6 | 18015 | -0.606 | -0.1870 | Yes |
| 84 | Usp18 | 18074 | -0.633 | -0.1653 | Yes |
| 85 | Tdrd7 | 18131 | -0.661 | -0.1424 | Yes |
| 86 | Cmpk2 | 18136 | -0.663 | -0.1165 | Yes |
| 87 | Ifi30 | 18152 | -0.671 | -0.0909 | Yes |
| 88 | Rsad2 | 18185 | -0.686 | -0.0656 | Yes |
| 89 | Ifit3 | 18298 | -0.759 | -0.0419 | Yes |
| 90 | Ifitm1 | 18407 | -1.215 | 0.0001 | Yes |