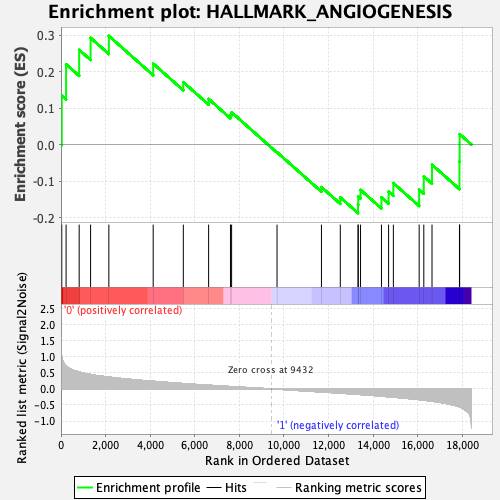
Profile of the Running ES Score & Positions of GeneSet Members on the Rank Ordered List
| Dataset | CLP.Basophil_Pheno.cls #Group1_versus_Group2.Basophil_Pheno.cls #Group1_versus_Group2_repos |
| Phenotype | Basophil_Pheno.cls#Group1_versus_Group2_repos |
| Upregulated in class | 0 |
| GeneSet | HALLMARK_ANGIOGENESIS |
| Enrichment Score (ES) | 0.29829866 |
| Normalized Enrichment Score (NES) | 0.9345036 |
| Nominal p-value | 0.56584364 |
| FDR q-value | 1.0 |
| FWER p-Value | 1.0 |
| SYMBOL | RANK IN GENE LIST | RANK METRIC SCORE | RUNNING ES | CORE ENRICHMENT | |
|---|---|---|---|---|---|
| 1 | Slco2a1 | 34 | 1.004 | 0.1342 | Yes |
| 2 | Prg2 | 228 | 0.714 | 0.2205 | Yes |
| 3 | Pglyrp1 | 815 | 0.526 | 0.2599 | Yes |
| 4 | Vegfa | 1327 | 0.448 | 0.2929 | Yes |
| 5 | Postn | 2146 | 0.368 | 0.2983 | Yes |
| 6 | Apoh | 4134 | 0.237 | 0.2223 | No |
| 7 | App | 5485 | 0.166 | 0.1714 | No |
| 8 | Ccnd2 | 6620 | 0.115 | 0.1253 | No |
| 9 | Tnfrsf21 | 7600 | 0.073 | 0.0819 | No |
| 10 | Olr1 | 7651 | 0.070 | 0.0887 | No |
| 11 | Vcan | 9688 | -0.008 | -0.0209 | No |
| 12 | Lrpap1 | 11680 | -0.094 | -0.1165 | No |
| 13 | Vav2 | 12525 | -0.131 | -0.1446 | No |
| 14 | Thbd | 13321 | -0.170 | -0.1648 | No |
| 15 | Itgav | 13331 | -0.170 | -0.1422 | No |
| 16 | Pdgfa | 13433 | -0.175 | -0.1240 | No |
| 17 | Spp1 | 14371 | -0.226 | -0.1444 | No |
| 18 | Jag2 | 14691 | -0.243 | -0.1287 | No |
| 19 | S100a4 | 14905 | -0.257 | -0.1054 | No |
| 20 | Pf4 | 16062 | -0.332 | -0.1233 | No |
| 21 | Ptk2 | 16270 | -0.350 | -0.0871 | No |
| 22 | Fstl1 | 16638 | -0.383 | -0.0551 | No |
| 23 | Fgfr1 | 17869 | -0.556 | -0.0466 | No |
| 24 | Nrp1 | 17878 | -0.560 | 0.0288 | No |

