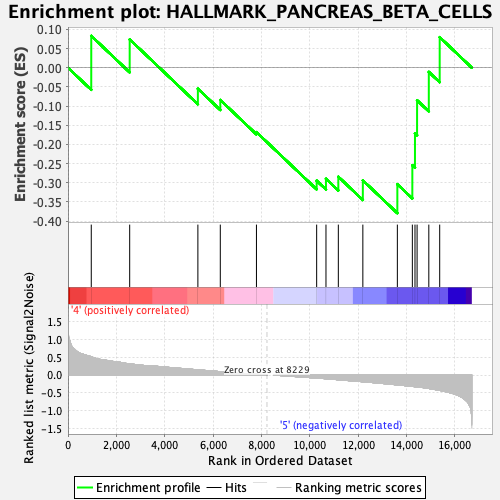
Profile of the Running ES Score & Positions of GeneSet Members on the Rank Ordered List
| Dataset | Basophil.Basophil_Pheno.cls #Group6_versus_Group8.Basophil_Pheno.cls #Group6_versus_Group8_repos |
| Phenotype | Basophil_Pheno.cls#Group6_versus_Group8_repos |
| Upregulated in class | 5 |
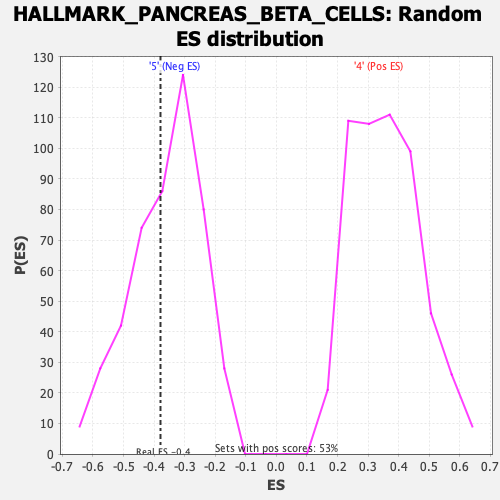
| GeneSet | HALLMARK_PANCREAS_BETA_CELLS |
| Enrichment Score (ES) | -0.3790804 |
| Normalized Enrichment Score (NES) | -1.0526732 |
| Nominal p-value | 0.39915073 |
| FDR q-value | 0.60543287 |
| FWER p-Value | 1.0 |
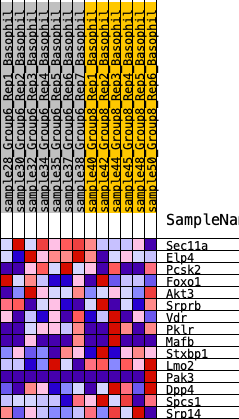
| SYMBOL | RANK IN GENE LIST | RANK METRIC SCORE | RUNNING ES | CORE ENRICHMENT | |
|---|---|---|---|---|---|
| 1 | Sec11a | 962 | 0.514 | 0.0830 | No |
| 2 | Elp4 | 2551 | 0.314 | 0.0737 | No |
| 3 | Pcsk2 | 5371 | 0.148 | -0.0548 | No |
| 4 | Foxo1 | 6298 | 0.095 | -0.0841 | No |
| 5 | Akt3 | 7793 | 0.021 | -0.1680 | No |
| 6 | Srprb | 10283 | -0.083 | -0.2944 | No |
| 7 | Vdr | 10668 | -0.102 | -0.2895 | No |
| 8 | Pklr | 11179 | -0.131 | -0.2841 | No |
| 9 | Mafb | 12193 | -0.187 | -0.2936 | No |
| 10 | Stxbp1 | 13620 | -0.275 | -0.3037 | Yes |
| 11 | Lmo2 | 14240 | -0.316 | -0.2542 | Yes |
| 12 | Pak3 | 14349 | -0.327 | -0.1709 | Yes |
| 13 | Dpp4 | 14436 | -0.333 | -0.0849 | Yes |
| 14 | Spcs1 | 14921 | -0.376 | -0.0110 | Yes |
| 15 | Srp14 | 15371 | -0.429 | 0.0796 | Yes |