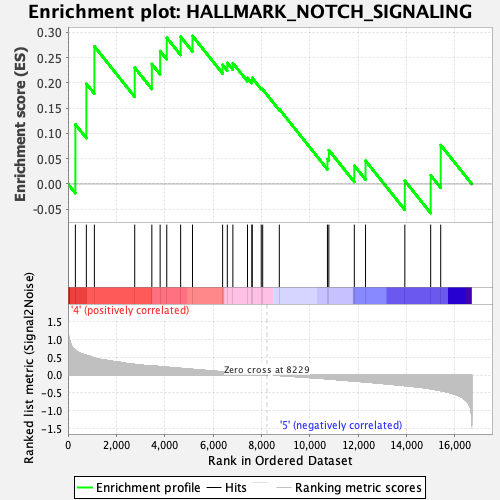
Profile of the Running ES Score & Positions of GeneSet Members on the Rank Ordered List
| Dataset | Basophil.Basophil_Pheno.cls #Group6_versus_Group8.Basophil_Pheno.cls #Group6_versus_Group8_repos |
| Phenotype | Basophil_Pheno.cls#Group6_versus_Group8_repos |
| Upregulated in class | 4 |
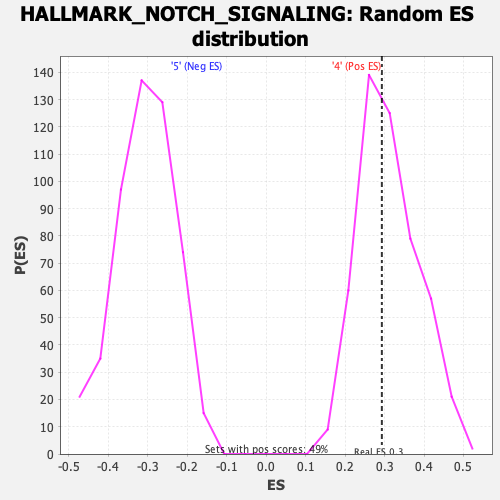
| GeneSet | HALLMARK_NOTCH_SIGNALING |
| Enrichment Score (ES) | 0.2931648 |
| Normalized Enrichment Score (NES) | 0.94276774 |
| Nominal p-value | 0.5386179 |
| FDR q-value | 0.83232945 |
| FWER p-Value | 1.0 |
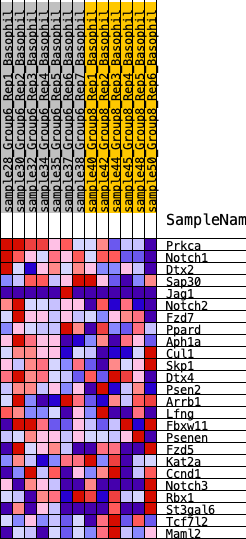
| SYMBOL | RANK IN GENE LIST | RANK METRIC SCORE | RUNNING ES | CORE ENRICHMENT | |
|---|---|---|---|---|---|
| 1 | Prkca | 305 | 0.700 | 0.1179 | Yes |
| 2 | Notch1 | 759 | 0.554 | 0.1986 | Yes |
| 3 | Dtx2 | 1091 | 0.482 | 0.2725 | Yes |
| 4 | Sap30 | 2759 | 0.297 | 0.2304 | Yes |
| 5 | Jag1 | 3467 | 0.255 | 0.2376 | Yes |
| 6 | Notch2 | 3810 | 0.236 | 0.2630 | Yes |
| 7 | Fzd7 | 4084 | 0.220 | 0.2895 | Yes |
| 8 | Ppard | 4658 | 0.187 | 0.2916 | Yes |
| 9 | Aph1a | 5148 | 0.159 | 0.2932 | Yes |
| 10 | Cul1 | 6394 | 0.090 | 0.2360 | No |
| 11 | Skp1 | 6588 | 0.079 | 0.2398 | No |
| 12 | Dtx4 | 6818 | 0.068 | 0.2393 | No |
| 13 | Psen2 | 7423 | 0.037 | 0.2102 | No |
| 14 | Arrb1 | 7603 | 0.029 | 0.2052 | No |
| 15 | Lfng | 7618 | 0.029 | 0.2100 | No |
| 16 | Fbxw11 | 7991 | 0.009 | 0.1895 | No |
| 17 | Psenen | 8051 | 0.006 | 0.1872 | No |
| 18 | Fzd5 | 8738 | -0.011 | 0.1482 | No |
| 19 | Kat2a | 10729 | -0.105 | 0.0493 | No |
| 20 | Ccnd1 | 10787 | -0.109 | 0.0671 | No |
| 21 | Notch3 | 11840 | -0.167 | 0.0364 | No |
| 22 | Rbx1 | 12304 | -0.193 | 0.0462 | No |
| 23 | St3gal6 | 13929 | -0.296 | 0.0064 | No |
| 24 | Tcf7l2 | 14998 | -0.385 | 0.0172 | No |
| 25 | Maml2 | 15413 | -0.436 | 0.0771 | No |