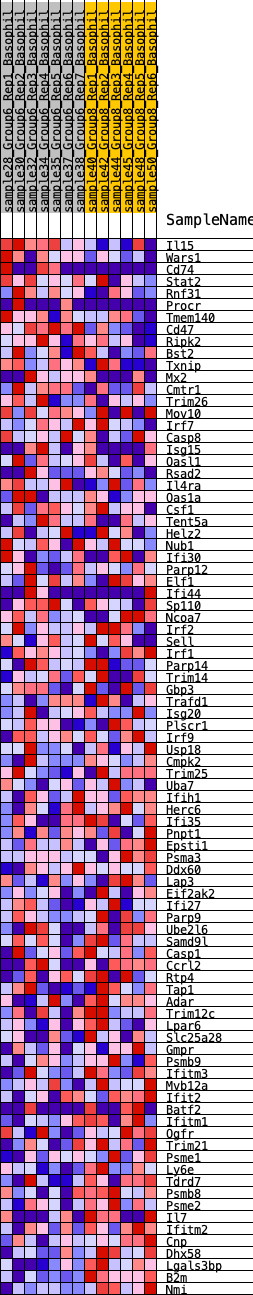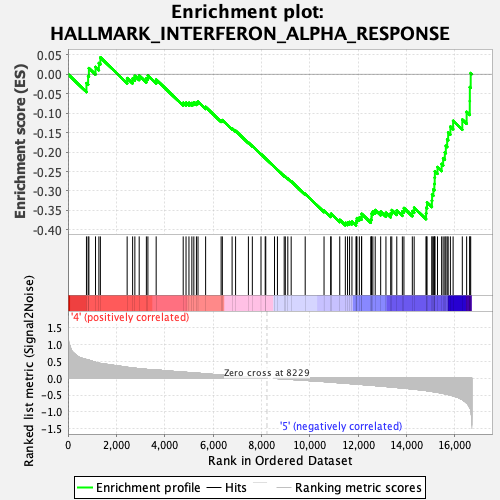
Profile of the Running ES Score & Positions of GeneSet Members on the Rank Ordered List
| Dataset | Basophil.Basophil_Pheno.cls #Group6_versus_Group8.Basophil_Pheno.cls #Group6_versus_Group8_repos |
| Phenotype | Basophil_Pheno.cls#Group6_versus_Group8_repos |
| Upregulated in class | 5 |
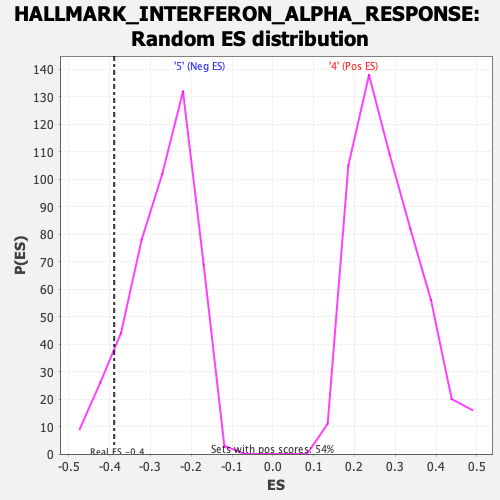
| GeneSet | HALLMARK_INTERFERON_ALPHA_RESPONSE |
| Enrichment Score (ES) | -0.3888525 |
| Normalized Enrichment Score (NES) | -1.434939 |
| Nominal p-value | 0.08423326 |
| FDR q-value | 0.15055594 |
| FWER p-Value | 0.52 |
| SYMBOL | RANK IN GENE LIST | RANK METRIC SCORE | RUNNING ES | CORE ENRICHMENT | |
|---|---|---|---|---|---|
| 1 | Il15 | 763 | 0.553 | -0.0231 | No |
| 2 | Wars1 | 832 | 0.543 | -0.0047 | No |
| 3 | Cd74 | 864 | 0.533 | 0.0154 | No |
| 4 | Stat2 | 1138 | 0.472 | 0.0185 | No |
| 5 | Rnf31 | 1277 | 0.446 | 0.0286 | No |
| 6 | Procr | 1339 | 0.439 | 0.0430 | No |
| 7 | Tmem140 | 2446 | 0.324 | -0.0102 | No |
| 8 | Cd47 | 2672 | 0.305 | -0.0111 | No |
| 9 | Ripk2 | 2765 | 0.297 | -0.0044 | No |
| 10 | Bst2 | 2944 | 0.282 | -0.0034 | No |
| 11 | Txnip | 3241 | 0.262 | -0.0104 | No |
| 12 | Mx2 | 3304 | 0.259 | -0.0034 | No |
| 13 | Cmtr1 | 3646 | 0.248 | -0.0137 | No |
| 14 | Trim26 | 4764 | 0.181 | -0.0735 | No |
| 15 | Mov10 | 4881 | 0.174 | -0.0733 | No |
| 16 | Irf7 | 5002 | 0.167 | -0.0736 | No |
| 17 | Casp8 | 5122 | 0.160 | -0.0741 | No |
| 18 | Isg15 | 5204 | 0.156 | -0.0726 | No |
| 19 | Oasl1 | 5311 | 0.151 | -0.0727 | No |
| 20 | Rsad2 | 5376 | 0.148 | -0.0705 | No |
| 21 | Il4ra | 5691 | 0.129 | -0.0840 | No |
| 22 | Oas1a | 6332 | 0.093 | -0.1187 | No |
| 23 | Csf1 | 6383 | 0.090 | -0.1180 | No |
| 24 | Tent5a | 6786 | 0.069 | -0.1393 | No |
| 25 | Helz2 | 6930 | 0.062 | -0.1454 | No |
| 26 | Nub1 | 7460 | 0.036 | -0.1757 | No |
| 27 | Ifi30 | 7623 | 0.029 | -0.1843 | No |
| 28 | Parp12 | 7981 | 0.010 | -0.2054 | No |
| 29 | Elf1 | 8155 | 0.003 | -0.2157 | No |
| 30 | Ifi44 | 8178 | 0.002 | -0.2169 | No |
| 31 | Sp110 | 8540 | -0.002 | -0.2386 | No |
| 32 | Ncoa7 | 8661 | -0.007 | -0.2455 | No |
| 33 | Irf2 | 8940 | -0.021 | -0.2614 | No |
| 34 | Sell | 8987 | -0.023 | -0.2632 | No |
| 35 | Irf1 | 9090 | -0.028 | -0.2682 | No |
| 36 | Parp14 | 9229 | -0.034 | -0.2750 | No |
| 37 | Trim14 | 9809 | -0.061 | -0.3074 | No |
| 38 | Gbp3 | 10588 | -0.098 | -0.3501 | No |
| 39 | Trafd1 | 10863 | -0.113 | -0.3620 | No |
| 40 | Isg20 | 10881 | -0.113 | -0.3583 | No |
| 41 | Plscr1 | 11238 | -0.135 | -0.3742 | No |
| 42 | Irf9 | 11469 | -0.146 | -0.3820 | Yes |
| 43 | Usp18 | 11560 | -0.152 | -0.3811 | Yes |
| 44 | Cmpk2 | 11643 | -0.156 | -0.3796 | Yes |
| 45 | Trim25 | 11742 | -0.162 | -0.3788 | Yes |
| 46 | Uba7 | 11910 | -0.171 | -0.3818 | Yes |
| 47 | Ifih1 | 11930 | -0.172 | -0.3758 | Yes |
| 48 | Herc6 | 11949 | -0.173 | -0.3698 | Yes |
| 49 | Ifi35 | 12048 | -0.179 | -0.3683 | Yes |
| 50 | Pnpt1 | 12139 | -0.184 | -0.3661 | Yes |
| 51 | Epsti1 | 12143 | -0.184 | -0.3587 | Yes |
| 52 | Psma3 | 12521 | -0.204 | -0.3729 | Yes |
| 53 | Ddx60 | 12555 | -0.207 | -0.3664 | Yes |
| 54 | Lap3 | 12556 | -0.207 | -0.3578 | Yes |
| 55 | Eif2ak2 | 12608 | -0.211 | -0.3522 | Yes |
| 56 | Ifi27 | 12704 | -0.217 | -0.3489 | Yes |
| 57 | Parp9 | 12930 | -0.230 | -0.3530 | Yes |
| 58 | Ube2l6 | 13148 | -0.244 | -0.3559 | Yes |
| 59 | Samd9l | 13345 | -0.257 | -0.3571 | Yes |
| 60 | Casp1 | 13390 | -0.260 | -0.3490 | Yes |
| 61 | Ccrl2 | 13596 | -0.274 | -0.3500 | Yes |
| 62 | Rtp4 | 13827 | -0.287 | -0.3520 | Yes |
| 63 | Tap1 | 13892 | -0.292 | -0.3438 | Yes |
| 64 | Adar | 14239 | -0.316 | -0.3516 | Yes |
| 65 | Trim12c | 14315 | -0.323 | -0.3427 | Yes |
| 66 | Lpar6 | 14807 | -0.364 | -0.3572 | Yes |
| 67 | Slc25a28 | 14819 | -0.366 | -0.3428 | Yes |
| 68 | Gmpr | 14848 | -0.369 | -0.3292 | Yes |
| 69 | Psmb9 | 15048 | -0.392 | -0.3250 | Yes |
| 70 | Ifitm3 | 15057 | -0.392 | -0.3092 | Yes |
| 71 | Mvb12a | 15109 | -0.398 | -0.2959 | Yes |
| 72 | Ifit2 | 15150 | -0.403 | -0.2816 | Yes |
| 73 | Batf2 | 15165 | -0.405 | -0.2657 | Yes |
| 74 | Ifitm1 | 15172 | -0.406 | -0.2493 | Yes |
| 75 | Ogfr | 15280 | -0.417 | -0.2385 | Yes |
| 76 | Trim21 | 15451 | -0.441 | -0.2306 | Yes |
| 77 | Psme1 | 15513 | -0.449 | -0.2157 | Yes |
| 78 | Ly6e | 15584 | -0.461 | -0.2009 | Yes |
| 79 | Tdrd7 | 15625 | -0.468 | -0.1839 | Yes |
| 80 | Psmb8 | 15680 | -0.478 | -0.1674 | Yes |
| 81 | Psme2 | 15721 | -0.485 | -0.1498 | Yes |
| 82 | Il7 | 15813 | -0.500 | -0.1346 | Yes |
| 83 | Ifitm2 | 15926 | -0.520 | -0.1199 | Yes |
| 84 | Cnp | 16306 | -0.633 | -0.1165 | Yes |
| 85 | Dhx58 | 16485 | -0.735 | -0.0969 | Yes |
| 86 | Lgals3bp | 16615 | -0.862 | -0.0690 | Yes |
| 87 | B2m | 16618 | -0.869 | -0.0332 | Yes |
| 88 | Nmi | 16653 | -0.920 | 0.0028 | Yes |