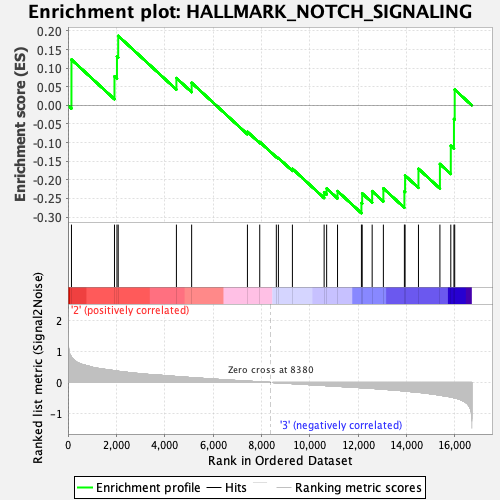
Profile of the Running ES Score & Positions of GeneSet Members on the Rank Ordered List
| Dataset | Basophil.Basophil_Pheno.cls #Group3_versus_Group4.Basophil_Pheno.cls #Group3_versus_Group4_repos |
| Phenotype | Basophil_Pheno.cls#Group3_versus_Group4_repos |
| Upregulated in class | 3 |
| GeneSet | HALLMARK_NOTCH_SIGNALING |
| Enrichment Score (ES) | -0.28944695 |
| Normalized Enrichment Score (NES) | -0.87550443 |
| Nominal p-value | 0.6242171 |
| FDR q-value | 0.973021 |
| FWER p-Value | 1.0 |
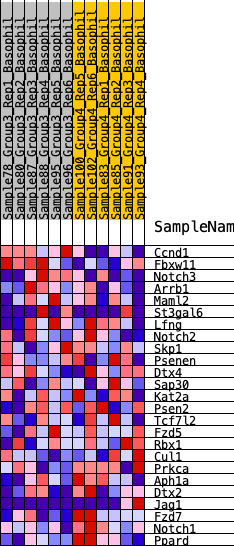
| SYMBOL | RANK IN GENE LIST | RANK METRIC SCORE | RUNNING ES | CORE ENRICHMENT | |
|---|---|---|---|---|---|
| 1 | Ccnd1 | 143 | 0.811 | 0.1231 | No |
| 2 | Fbxw11 | 1922 | 0.378 | 0.0779 | No |
| 3 | Notch3 | 2025 | 0.366 | 0.1312 | No |
| 4 | Arrb1 | 2076 | 0.360 | 0.1866 | No |
| 5 | Maml2 | 4483 | 0.191 | 0.0733 | No |
| 6 | St3gal6 | 5113 | 0.155 | 0.0607 | No |
| 7 | Lfng | 7420 | 0.042 | -0.0709 | No |
| 8 | Notch2 | 7929 | 0.019 | -0.0982 | No |
| 9 | Skp1 | 8615 | -0.008 | -0.1381 | No |
| 10 | Psenen | 8701 | -0.011 | -0.1414 | No |
| 11 | Dtx4 | 9280 | -0.036 | -0.1703 | No |
| 12 | Sap30 | 10592 | -0.096 | -0.2333 | No |
| 13 | Kat2a | 10696 | -0.101 | -0.2231 | No |
| 14 | Psen2 | 11146 | -0.122 | -0.2303 | No |
| 15 | Tcf7l2 | 12134 | -0.168 | -0.2621 | Yes |
| 16 | Fzd5 | 12166 | -0.170 | -0.2365 | Yes |
| 17 | Rbx1 | 12578 | -0.189 | -0.2304 | Yes |
| 18 | Cul1 | 13042 | -0.217 | -0.2229 | Yes |
| 19 | Prkca | 13911 | -0.270 | -0.2311 | Yes |
| 20 | Aph1a | 13940 | -0.273 | -0.1884 | Yes |
| 21 | Dtx2 | 14493 | -0.316 | -0.1703 | Yes |
| 22 | Jag1 | 15380 | -0.407 | -0.1574 | Yes |
| 23 | Fzd7 | 15830 | -0.467 | -0.1085 | Yes |
| 24 | Notch1 | 15961 | -0.491 | -0.0366 | Yes |
| 25 | Ppard | 15992 | -0.498 | 0.0424 | Yes |