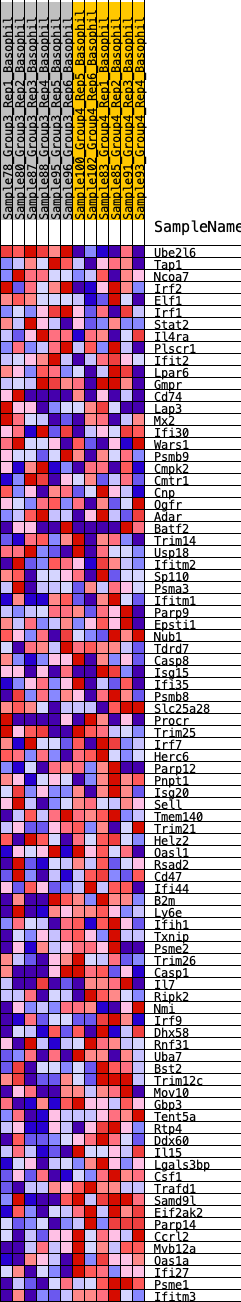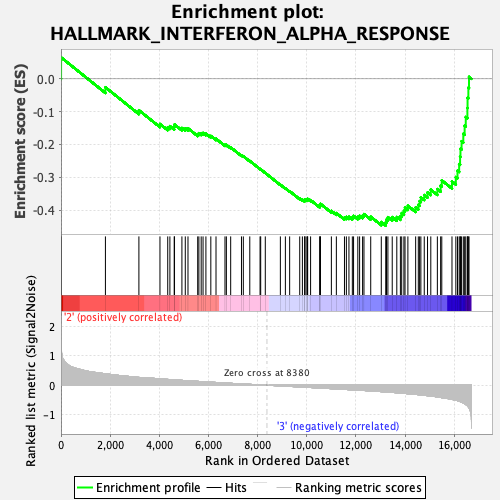
Profile of the Running ES Score & Positions of GeneSet Members on the Rank Ordered List
| Dataset | Basophil.Basophil_Pheno.cls #Group3_versus_Group4.Basophil_Pheno.cls #Group3_versus_Group4_repos |
| Phenotype | Basophil_Pheno.cls#Group3_versus_Group4_repos |
| Upregulated in class | 3 |
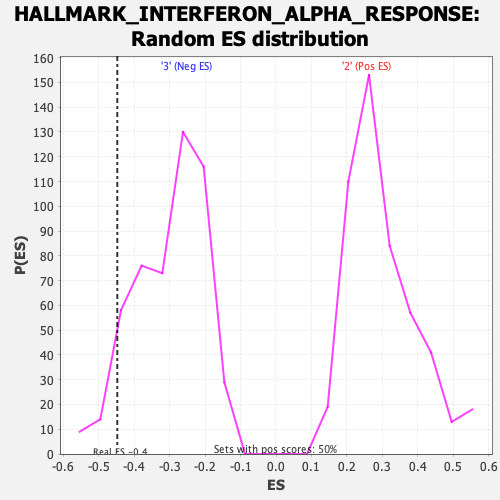
| GeneSet | HALLMARK_INTERFERON_ALPHA_RESPONSE |
| Enrichment Score (ES) | -0.44743243 |
| Normalized Enrichment Score (NES) | -1.4869994 |
| Nominal p-value | 0.07722772 |
| FDR q-value | 0.28155336 |
| FWER p-Value | 0.418 |
| SYMBOL | RANK IN GENE LIST | RANK METRIC SCORE | RUNNING ES | CORE ENRICHMENT | |
|---|---|---|---|---|---|
| 1 | Ube2l6 | 4 | 1.467 | 0.0653 | No |
| 2 | Tap1 | 1807 | 0.390 | -0.0258 | No |
| 3 | Ncoa7 | 3169 | 0.266 | -0.0958 | No |
| 4 | Irf2 | 4026 | 0.217 | -0.1376 | No |
| 5 | Elf1 | 4342 | 0.198 | -0.1477 | No |
| 6 | Irf1 | 4430 | 0.193 | -0.1443 | No |
| 7 | Stat2 | 4605 | 0.183 | -0.1466 | No |
| 8 | Il4ra | 4618 | 0.183 | -0.1392 | No |
| 9 | Plscr1 | 4919 | 0.165 | -0.1499 | No |
| 10 | Ifit2 | 5056 | 0.158 | -0.1510 | No |
| 11 | Lpar6 | 5166 | 0.151 | -0.1508 | No |
| 12 | Gmpr | 5561 | 0.131 | -0.1687 | No |
| 13 | Cd74 | 5609 | 0.129 | -0.1658 | No |
| 14 | Lap3 | 5703 | 0.124 | -0.1658 | No |
| 15 | Mx2 | 5779 | 0.120 | -0.1650 | No |
| 16 | Ifi30 | 5895 | 0.114 | -0.1668 | No |
| 17 | Wars1 | 6095 | 0.104 | -0.1742 | No |
| 18 | Psmb9 | 6306 | 0.094 | -0.1826 | No |
| 19 | Cmpk2 | 6671 | 0.075 | -0.2012 | No |
| 20 | Cmtr1 | 6728 | 0.072 | -0.2013 | No |
| 21 | Cnp | 6903 | 0.065 | -0.2089 | No |
| 22 | Ogfr | 7342 | 0.045 | -0.2333 | No |
| 23 | Adar | 7417 | 0.042 | -0.2359 | No |
| 24 | Batf2 | 7680 | 0.030 | -0.2503 | No |
| 25 | Trim14 | 8098 | 0.012 | -0.2748 | No |
| 26 | Usp18 | 8124 | 0.011 | -0.2759 | No |
| 27 | Ifitm2 | 8311 | 0.002 | -0.2870 | No |
| 28 | Sp110 | 8924 | -0.021 | -0.3229 | No |
| 29 | Psma3 | 9128 | -0.029 | -0.3338 | No |
| 30 | Ifitm1 | 9302 | -0.037 | -0.3426 | No |
| 31 | Parp9 | 9712 | -0.055 | -0.3647 | No |
| 32 | Epsti1 | 9820 | -0.060 | -0.3685 | No |
| 33 | Nub1 | 9912 | -0.065 | -0.3710 | No |
| 34 | Tdrd7 | 9919 | -0.065 | -0.3685 | No |
| 35 | Casp8 | 9973 | -0.068 | -0.3687 | No |
| 36 | Isg15 | 10028 | -0.070 | -0.3688 | No |
| 37 | Ifi35 | 10035 | -0.070 | -0.3660 | No |
| 38 | Psmb8 | 10154 | -0.076 | -0.3697 | No |
| 39 | Slc25a28 | 10527 | -0.093 | -0.3879 | No |
| 40 | Procr | 10534 | -0.094 | -0.3841 | No |
| 41 | Trim25 | 10556 | -0.094 | -0.3812 | No |
| 42 | Irf7 | 10999 | -0.115 | -0.4026 | No |
| 43 | Herc6 | 11202 | -0.124 | -0.4093 | No |
| 44 | Parp12 | 11532 | -0.140 | -0.4228 | No |
| 45 | Pnpt1 | 11609 | -0.144 | -0.4210 | No |
| 46 | Isg20 | 11714 | -0.149 | -0.4206 | No |
| 47 | Sell | 11852 | -0.155 | -0.4219 | No |
| 48 | Tmem140 | 11902 | -0.157 | -0.4179 | No |
| 49 | Trim21 | 12075 | -0.165 | -0.4209 | No |
| 50 | Helz2 | 12148 | -0.169 | -0.4177 | No |
| 51 | Oasl1 | 12269 | -0.175 | -0.4171 | No |
| 52 | Rsad2 | 12325 | -0.178 | -0.4125 | No |
| 53 | Cd47 | 12600 | -0.191 | -0.4204 | No |
| 54 | Ifi44 | 13030 | -0.216 | -0.4366 | No |
| 55 | B2m | 13211 | -0.226 | -0.4373 | Yes |
| 56 | Ly6e | 13242 | -0.229 | -0.4289 | Yes |
| 57 | Ifih1 | 13299 | -0.233 | -0.4219 | Yes |
| 58 | Txnip | 13475 | -0.243 | -0.4215 | Yes |
| 59 | Psme2 | 13661 | -0.254 | -0.4213 | Yes |
| 60 | Trim26 | 13807 | -0.264 | -0.4183 | Yes |
| 61 | Casp1 | 13860 | -0.268 | -0.4094 | Yes |
| 62 | Il7 | 13950 | -0.274 | -0.4026 | Yes |
| 63 | Ripk2 | 13995 | -0.278 | -0.3928 | Yes |
| 64 | Nmi | 14112 | -0.287 | -0.3870 | Yes |
| 65 | Irf9 | 14428 | -0.311 | -0.3920 | Yes |
| 66 | Dhx58 | 14536 | -0.320 | -0.3842 | Yes |
| 67 | Rnf31 | 14589 | -0.324 | -0.3729 | Yes |
| 68 | Uba7 | 14640 | -0.327 | -0.3613 | Yes |
| 69 | Bst2 | 14778 | -0.340 | -0.3543 | Yes |
| 70 | Trim12c | 14911 | -0.354 | -0.3465 | Yes |
| 71 | Mov10 | 15044 | -0.368 | -0.3380 | Yes |
| 72 | Gbp3 | 15311 | -0.399 | -0.3362 | Yes |
| 73 | Tent5a | 15444 | -0.415 | -0.3256 | Yes |
| 74 | Rtp4 | 15491 | -0.421 | -0.3095 | Yes |
| 75 | Ddx60 | 15906 | -0.481 | -0.3129 | Yes |
| 76 | Il15 | 16063 | -0.512 | -0.2994 | Yes |
| 77 | Lgals3bp | 16130 | -0.523 | -0.2801 | Yes |
| 78 | Csf1 | 16198 | -0.541 | -0.2600 | Yes |
| 79 | Trafd1 | 16236 | -0.554 | -0.2374 | Yes |
| 80 | Samd9l | 16251 | -0.559 | -0.2133 | Yes |
| 81 | Eif2ak2 | 16296 | -0.576 | -0.1902 | Yes |
| 82 | Parp14 | 16367 | -0.603 | -0.1675 | Yes |
| 83 | Ccrl2 | 16421 | -0.625 | -0.1428 | Yes |
| 84 | Mvb12a | 16467 | -0.653 | -0.1164 | Yes |
| 85 | Oas1a | 16533 | -0.698 | -0.0891 | Yes |
| 86 | Ifi27 | 16540 | -0.706 | -0.0579 | Yes |
| 87 | Psme1 | 16573 | -0.738 | -0.0269 | Yes |
| 88 | Ifitm3 | 16599 | -0.771 | 0.0060 | Yes |