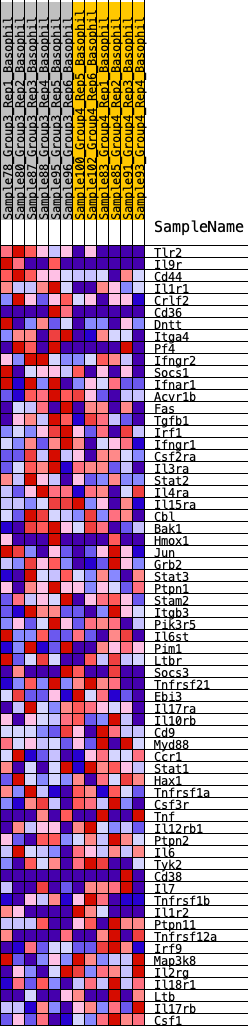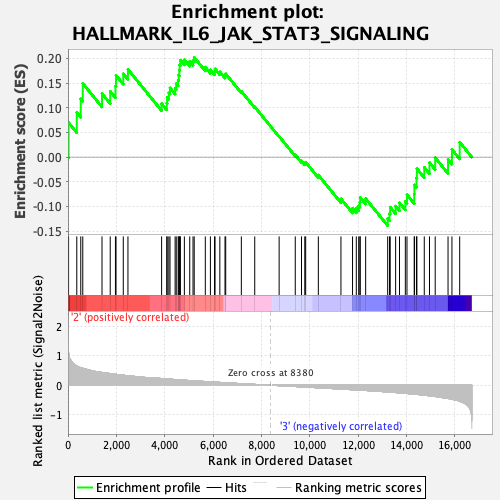
Profile of the Running ES Score & Positions of GeneSet Members on the Rank Ordered List
| Dataset | Basophil.Basophil_Pheno.cls #Group3_versus_Group4.Basophil_Pheno.cls #Group3_versus_Group4_repos |
| Phenotype | Basophil_Pheno.cls#Group3_versus_Group4_repos |
| Upregulated in class | 2 |
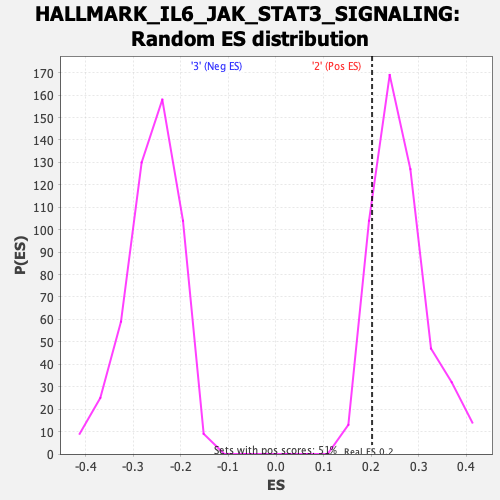
| GeneSet | HALLMARK_IL6_JAK_STAT3_SIGNALING |
| Enrichment Score (ES) | 0.20191215 |
| Normalized Enrichment Score (NES) | 0.77986383 |
| Nominal p-value | 0.88142294 |
| FDR q-value | 0.9131397 |
| FWER p-Value | 1.0 |
| SYMBOL | RANK IN GENE LIST | RANK METRIC SCORE | RUNNING ES | CORE ENRICHMENT | |
|---|---|---|---|---|---|
| 1 | Tlr2 | 24 | 1.134 | 0.0698 | Yes |
| 2 | Il9r | 363 | 0.653 | 0.0905 | Yes |
| 3 | Cd44 | 528 | 0.595 | 0.1180 | Yes |
| 4 | Il1r1 | 611 | 0.574 | 0.1492 | Yes |
| 5 | Crlf2 | 1406 | 0.434 | 0.1287 | Yes |
| 6 | Cd36 | 1746 | 0.395 | 0.1332 | Yes |
| 7 | Dntt | 1962 | 0.374 | 0.1437 | Yes |
| 8 | Itga4 | 1986 | 0.371 | 0.1657 | Yes |
| 9 | Pf4 | 2286 | 0.339 | 0.1690 | Yes |
| 10 | Ifngr2 | 2479 | 0.322 | 0.1777 | Yes |
| 11 | Socs1 | 3871 | 0.228 | 0.1084 | Yes |
| 12 | Ifnar1 | 4084 | 0.213 | 0.1090 | Yes |
| 13 | Acvr1b | 4101 | 0.211 | 0.1213 | Yes |
| 14 | Fas | 4170 | 0.207 | 0.1303 | Yes |
| 15 | Tgfb1 | 4218 | 0.203 | 0.1402 | Yes |
| 16 | Irf1 | 4430 | 0.193 | 0.1397 | Yes |
| 17 | Ifngr1 | 4476 | 0.191 | 0.1490 | Yes |
| 18 | Csf2ra | 4555 | 0.186 | 0.1559 | Yes |
| 19 | Il3ra | 4578 | 0.185 | 0.1662 | Yes |
| 20 | Stat2 | 4605 | 0.183 | 0.1762 | Yes |
| 21 | Il4ra | 4618 | 0.183 | 0.1869 | Yes |
| 22 | Il15ra | 4649 | 0.179 | 0.1964 | Yes |
| 23 | Cbl | 4812 | 0.171 | 0.1974 | Yes |
| 24 | Bak1 | 5034 | 0.159 | 0.1941 | Yes |
| 25 | Hmox1 | 5170 | 0.151 | 0.1955 | Yes |
| 26 | Jun | 5219 | 0.149 | 0.2019 | Yes |
| 27 | Grb2 | 5678 | 0.125 | 0.1823 | No |
| 28 | Stat3 | 5889 | 0.114 | 0.1768 | No |
| 29 | Ptpn1 | 6059 | 0.105 | 0.1733 | No |
| 30 | Stam2 | 6080 | 0.105 | 0.1786 | No |
| 31 | Itgb3 | 6279 | 0.096 | 0.1727 | No |
| 32 | Pik3r5 | 6493 | 0.084 | 0.1652 | No |
| 33 | Il6st | 6522 | 0.082 | 0.1687 | No |
| 34 | Pim1 | 7168 | 0.053 | 0.1332 | No |
| 35 | Ltbr | 7722 | 0.028 | 0.1018 | No |
| 36 | Socs3 | 8731 | -0.012 | 0.0419 | No |
| 37 | Tnfrsf21 | 9398 | -0.042 | 0.0045 | No |
| 38 | Ebi3 | 9656 | -0.053 | -0.0076 | No |
| 39 | Il17ra | 9792 | -0.059 | -0.0120 | No |
| 40 | Il10rb | 9829 | -0.061 | -0.0104 | No |
| 41 | Cd9 | 10352 | -0.085 | -0.0364 | No |
| 42 | Myd88 | 11287 | -0.129 | -0.0845 | No |
| 43 | Ccr1 | 11767 | -0.151 | -0.1038 | No |
| 44 | Stat1 | 11922 | -0.158 | -0.1031 | No |
| 45 | Hax1 | 12021 | -0.162 | -0.0988 | No |
| 46 | Tnfrsf1a | 12072 | -0.165 | -0.0914 | No |
| 47 | Csf3r | 12083 | -0.166 | -0.0816 | No |
| 48 | Tnf | 12309 | -0.177 | -0.0840 | No |
| 49 | Il12rb1 | 13220 | -0.227 | -0.1245 | No |
| 50 | Ptpn2 | 13296 | -0.233 | -0.1144 | No |
| 51 | Il6 | 13324 | -0.234 | -0.1013 | No |
| 52 | Tyk2 | 13549 | -0.247 | -0.0992 | No |
| 53 | Cd38 | 13709 | -0.258 | -0.0925 | No |
| 54 | Il7 | 13950 | -0.274 | -0.0898 | No |
| 55 | Tnfrsf1b | 14018 | -0.279 | -0.0762 | No |
| 56 | Il1r2 | 14319 | -0.304 | -0.0751 | No |
| 57 | Ptpn11 | 14326 | -0.305 | -0.0564 | No |
| 58 | Tnfrsf12a | 14410 | -0.309 | -0.0419 | No |
| 59 | Irf9 | 14428 | -0.311 | -0.0234 | No |
| 60 | Map3k8 | 14733 | -0.335 | -0.0207 | No |
| 61 | Il2rg | 14949 | -0.359 | -0.0110 | No |
| 62 | Il18r1 | 15185 | -0.380 | -0.0013 | No |
| 63 | Ltb | 15716 | -0.450 | -0.0048 | No |
| 64 | Il17rb | 15877 | -0.475 | 0.0154 | No |
| 65 | Csf1 | 16198 | -0.541 | 0.0301 | No |