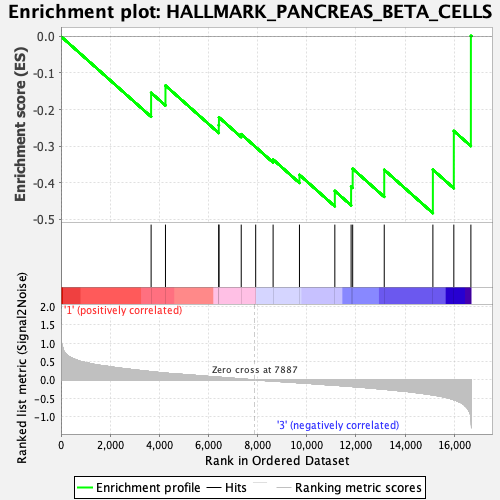
Profile of the Running ES Score & Positions of GeneSet Members on the Rank Ordered List
| Dataset | Basophil.Basophil_Pheno.cls #Group2_versus_Group4.Basophil_Pheno.cls #Group2_versus_Group4_repos |
| Phenotype | Basophil_Pheno.cls#Group2_versus_Group4_repos |
| Upregulated in class | 3 |
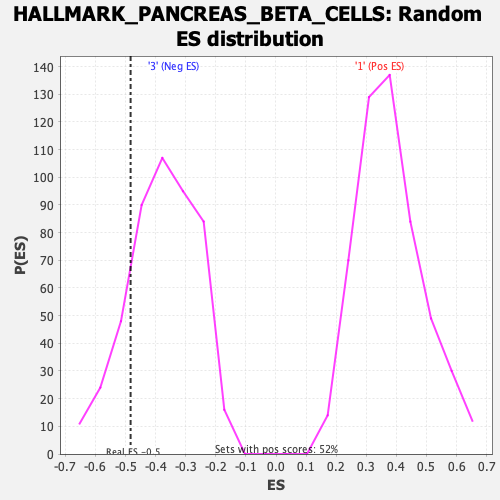
| GeneSet | HALLMARK_PANCREAS_BETA_CELLS |
| Enrichment Score (ES) | -0.4832093 |
| Normalized Enrichment Score (NES) | -1.2767206 |
| Nominal p-value | 0.1663158 |
| FDR q-value | 0.71561533 |
| FWER p-Value | 0.864 |
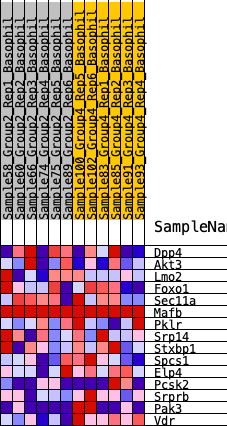
| SYMBOL | RANK IN GENE LIST | RANK METRIC SCORE | RUNNING ES | CORE ENRICHMENT | |
|---|---|---|---|---|---|
| 1 | Dpp4 | 3666 | 0.224 | -0.1541 | No |
| 2 | Akt3 | 4250 | 0.187 | -0.1343 | No |
| 3 | Lmo2 | 6418 | 0.074 | -0.2424 | No |
| 4 | Foxo1 | 6426 | 0.074 | -0.2211 | No |
| 5 | Sec11a | 7332 | 0.027 | -0.2673 | No |
| 6 | Mafb | 7920 | 0.000 | -0.3025 | No |
| 7 | Pklr | 8629 | -0.029 | -0.3365 | No |
| 8 | Srp14 | 9701 | -0.076 | -0.3785 | No |
| 9 | Stxbp1 | 11140 | -0.144 | -0.4223 | Yes |
| 10 | Spcs1 | 11802 | -0.176 | -0.4104 | Yes |
| 11 | Elp4 | 11866 | -0.179 | -0.3618 | Yes |
| 12 | Pcsk2 | 13150 | -0.253 | -0.3647 | Yes |
| 13 | Srprb | 15129 | -0.406 | -0.3643 | Yes |
| 14 | Pak3 | 15981 | -0.536 | -0.2584 | Yes |
| 15 | Vdr | 16675 | -1.028 | 0.0014 | Yes |