Profile of the Running ES Score & Positions of GeneSet Members on the Rank Ordered List
| Dataset | Basophil.Basophil_Pheno.cls #Group2_versus_Group4.Basophil_Pheno.cls #Group2_versus_Group4_repos |
| Phenotype | Basophil_Pheno.cls#Group2_versus_Group4_repos |
| Upregulated in class | 3 |
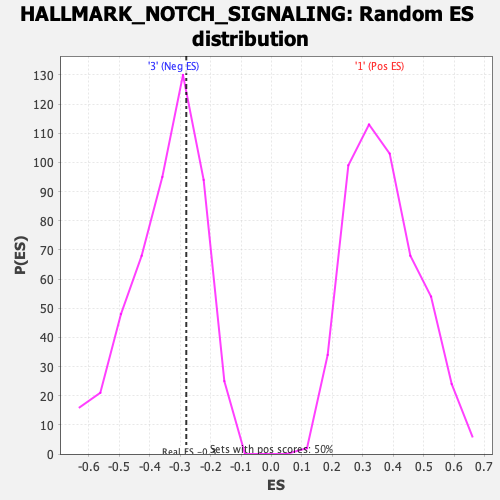
| GeneSet | HALLMARK_NOTCH_SIGNALING |
| Enrichment Score (ES) | -0.2799953 |
| Normalized Enrichment Score (NES) | -0.80619925 |
| Nominal p-value | 0.66599596 |
| FDR q-value | 0.9383917 |
| FWER p-Value | 1.0 |
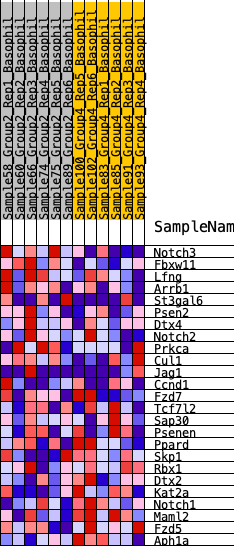
| SYMBOL | RANK IN GENE LIST | RANK METRIC SCORE | RUNNING ES | CORE ENRICHMENT | |
|---|---|---|---|---|---|
| 1 | Notch3 | 271 | 0.666 | 0.0895 | No |
| 2 | Fbxw11 | 1165 | 0.451 | 0.1077 | No |
| 3 | Lfng | 1949 | 0.367 | 0.1190 | No |
| 4 | Arrb1 | 2761 | 0.293 | 0.1169 | No |
| 5 | St3gal6 | 3009 | 0.274 | 0.1456 | No |
| 6 | Psen2 | 3029 | 0.272 | 0.1877 | No |
| 7 | Dtx4 | 3416 | 0.244 | 0.2033 | No |
| 8 | Notch2 | 4887 | 0.154 | 0.1395 | No |
| 9 | Prkca | 6036 | 0.094 | 0.0856 | No |
| 10 | Cul1 | 6394 | 0.076 | 0.0762 | No |
| 11 | Jag1 | 6883 | 0.050 | 0.0549 | No |
| 12 | Ccnd1 | 7017 | 0.044 | 0.0539 | No |
| 13 | Fzd7 | 8754 | -0.035 | -0.0446 | No |
| 14 | Tcf7l2 | 8899 | -0.041 | -0.0467 | No |
| 15 | Sap30 | 8948 | -0.042 | -0.0429 | No |
| 16 | Psenen | 9868 | -0.083 | -0.0848 | No |
| 17 | Ppard | 11409 | -0.156 | -0.1525 | No |
| 18 | Skp1 | 11801 | -0.176 | -0.1480 | No |
| 19 | Rbx1 | 12756 | -0.229 | -0.1689 | No |
| 20 | Dtx2 | 14610 | -0.357 | -0.2233 | Yes |
| 21 | Kat2a | 14982 | -0.391 | -0.1834 | Yes |
| 22 | Notch1 | 15091 | -0.401 | -0.1262 | Yes |
| 23 | Maml2 | 15371 | -0.435 | -0.0739 | Yes |
| 24 | Fzd5 | 15632 | -0.467 | -0.0152 | Yes |
| 25 | Aph1a | 15811 | -0.498 | 0.0533 | Yes |