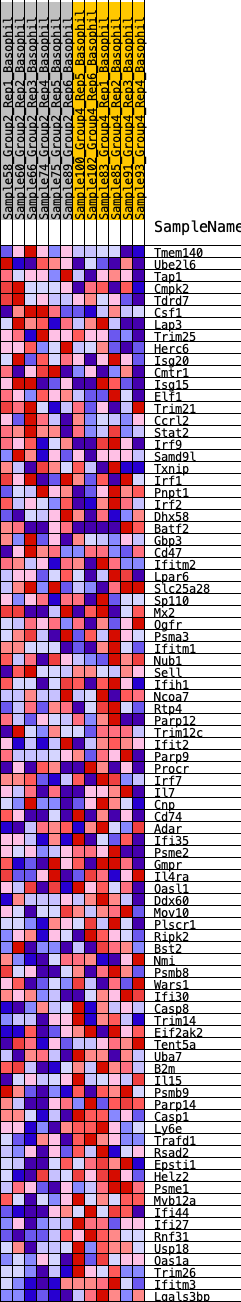
Profile of the Running ES Score & Positions of GeneSet Members on the Rank Ordered List
| Dataset | Basophil.Basophil_Pheno.cls #Group2_versus_Group4.Basophil_Pheno.cls #Group2_versus_Group4_repos |
| Phenotype | Basophil_Pheno.cls#Group2_versus_Group4_repos |
| Upregulated in class | 3 |
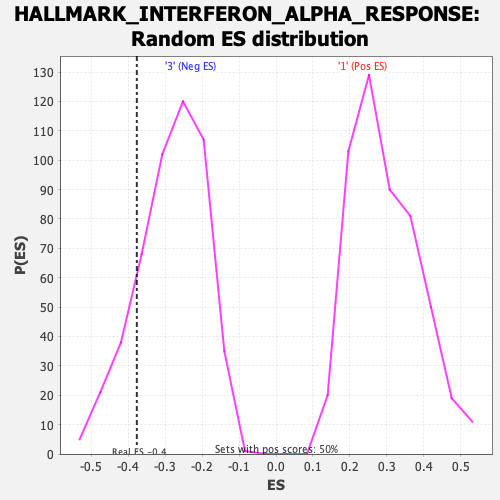
| GeneSet | HALLMARK_INTERFERON_ALPHA_RESPONSE |
| Enrichment Score (ES) | -0.37631238 |
| Normalized Enrichment Score (NES) | -1.327827 |
| Nominal p-value | 0.18108653 |
| FDR q-value | 1.0 |
| FWER p-Value | 0.774 |
| SYMBOL | RANK IN GENE LIST | RANK METRIC SCORE | RUNNING ES | CORE ENRICHMENT | |
|---|---|---|---|---|---|
| 1 | Tmem140 | 902 | 0.488 | -0.0315 | No |
| 2 | Ube2l6 | 943 | 0.481 | -0.0114 | No |
| 3 | Tap1 | 1339 | 0.425 | -0.0153 | No |
| 4 | Cmpk2 | 1552 | 0.401 | -0.0093 | No |
| 5 | Tdrd7 | 1796 | 0.378 | -0.0062 | No |
| 6 | Csf1 | 2062 | 0.353 | -0.0057 | No |
| 7 | Lap3 | 2187 | 0.340 | 0.0028 | No |
| 8 | Trim25 | 2872 | 0.284 | -0.0251 | No |
| 9 | Herc6 | 3323 | 0.250 | -0.0405 | No |
| 10 | Isg20 | 3345 | 0.249 | -0.0301 | No |
| 11 | Cmtr1 | 3586 | 0.231 | -0.0338 | No |
| 12 | Isg15 | 3819 | 0.215 | -0.0377 | No |
| 13 | Elf1 | 4434 | 0.175 | -0.0665 | No |
| 14 | Trim21 | 4687 | 0.165 | -0.0739 | No |
| 15 | Ccrl2 | 4860 | 0.155 | -0.0770 | No |
| 16 | Stat2 | 4922 | 0.152 | -0.0736 | No |
| 17 | Irf9 | 4998 | 0.147 | -0.0712 | No |
| 18 | Samd9l | 6066 | 0.092 | -0.1311 | No |
| 19 | Txnip | 6356 | 0.077 | -0.1449 | No |
| 20 | Irf1 | 6381 | 0.076 | -0.1428 | No |
| 21 | Pnpt1 | 6393 | 0.076 | -0.1399 | No |
| 22 | Irf2 | 6403 | 0.075 | -0.1369 | No |
| 23 | Dhx58 | 6423 | 0.074 | -0.1346 | No |
| 24 | Batf2 | 6499 | 0.071 | -0.1358 | No |
| 25 | Gbp3 | 6691 | 0.061 | -0.1445 | No |
| 26 | Cd47 | 6905 | 0.049 | -0.1550 | No |
| 27 | Ifitm2 | 7169 | 0.036 | -0.1691 | No |
| 28 | Lpar6 | 7322 | 0.028 | -0.1770 | No |
| 29 | Slc25a28 | 7347 | 0.026 | -0.1772 | No |
| 30 | Sp110 | 7738 | 0.007 | -0.2003 | No |
| 31 | Mx2 | 8269 | -0.013 | -0.2316 | No |
| 32 | Ogfr | 8291 | -0.014 | -0.2322 | No |
| 33 | Psma3 | 8375 | -0.018 | -0.2364 | No |
| 34 | Ifitm1 | 8442 | -0.021 | -0.2394 | No |
| 35 | Nub1 | 8457 | -0.021 | -0.2392 | No |
| 36 | Sell | 8775 | -0.036 | -0.2566 | No |
| 37 | Ifih1 | 8900 | -0.041 | -0.2622 | No |
| 38 | Ncoa7 | 8962 | -0.043 | -0.2639 | No |
| 39 | Rtp4 | 9045 | -0.046 | -0.2666 | No |
| 40 | Parp12 | 9424 | -0.063 | -0.2864 | No |
| 41 | Trim12c | 9471 | -0.065 | -0.2862 | No |
| 42 | Ifit2 | 9612 | -0.072 | -0.2912 | No |
| 43 | Parp9 | 9648 | -0.073 | -0.2899 | No |
| 44 | Procr | 9948 | -0.087 | -0.3039 | No |
| 45 | Irf7 | 10672 | -0.121 | -0.3417 | No |
| 46 | Il7 | 10784 | -0.127 | -0.3425 | No |
| 47 | Cnp | 11017 | -0.139 | -0.3500 | No |
| 48 | Cd74 | 11111 | -0.143 | -0.3489 | No |
| 49 | Adar | 11147 | -0.145 | -0.3442 | No |
| 50 | Ifi35 | 11250 | -0.149 | -0.3434 | No |
| 51 | Psme2 | 11623 | -0.168 | -0.3580 | No |
| 52 | Gmpr | 11629 | -0.168 | -0.3504 | No |
| 53 | Il4ra | 11748 | -0.173 | -0.3494 | No |
| 54 | Oasl1 | 11945 | -0.184 | -0.3527 | No |
| 55 | Ddx60 | 11949 | -0.184 | -0.3442 | No |
| 56 | Mov10 | 12017 | -0.187 | -0.3395 | No |
| 57 | Plscr1 | 12475 | -0.212 | -0.3571 | No |
| 58 | Ripk2 | 12505 | -0.214 | -0.3489 | No |
| 59 | Bst2 | 12615 | -0.220 | -0.3451 | No |
| 60 | Nmi | 12764 | -0.229 | -0.3433 | No |
| 61 | Psmb8 | 12832 | -0.233 | -0.3365 | No |
| 62 | Wars1 | 13113 | -0.250 | -0.3416 | No |
| 63 | Ifi30 | 13690 | -0.288 | -0.3629 | Yes |
| 64 | Casp8 | 13773 | -0.293 | -0.3541 | Yes |
| 65 | Trim14 | 14017 | -0.309 | -0.3543 | Yes |
| 66 | Eif2ak2 | 14025 | -0.310 | -0.3402 | Yes |
| 67 | Tent5a | 14080 | -0.312 | -0.3288 | Yes |
| 68 | Uba7 | 14158 | -0.318 | -0.3186 | Yes |
| 69 | B2m | 14331 | -0.333 | -0.3134 | Yes |
| 70 | Il15 | 14399 | -0.338 | -0.3016 | Yes |
| 71 | Psmb9 | 14645 | -0.360 | -0.2995 | Yes |
| 72 | Parp14 | 14811 | -0.375 | -0.2919 | Yes |
| 73 | Casp1 | 15111 | -0.404 | -0.2910 | Yes |
| 74 | Ly6e | 15305 | -0.426 | -0.2827 | Yes |
| 75 | Trafd1 | 15368 | -0.435 | -0.2662 | Yes |
| 76 | Rsad2 | 15481 | -0.449 | -0.2519 | Yes |
| 77 | Epsti1 | 15567 | -0.457 | -0.2356 | Yes |
| 78 | Helz2 | 15638 | -0.468 | -0.2180 | Yes |
| 79 | Psme1 | 15769 | -0.492 | -0.2028 | Yes |
| 80 | Mvb12a | 16024 | -0.546 | -0.1925 | Yes |
| 81 | Ifi44 | 16088 | -0.562 | -0.1700 | Yes |
| 82 | Ifi27 | 16148 | -0.579 | -0.1465 | Yes |
| 83 | Rnf31 | 16172 | -0.587 | -0.1205 | Yes |
| 84 | Usp18 | 16213 | -0.598 | -0.0949 | Yes |
| 85 | Oas1a | 16222 | -0.600 | -0.0673 | Yes |
| 86 | Trim26 | 16300 | -0.629 | -0.0426 | Yes |
| 87 | Ifitm3 | 16320 | -0.636 | -0.0140 | Yes |
| 88 | Lgals3bp | 16546 | -0.786 | 0.0092 | Yes |