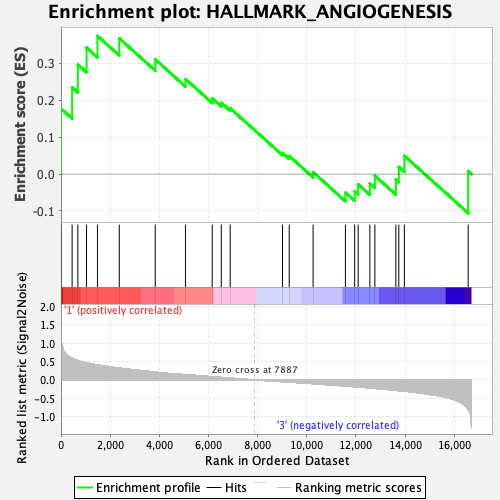
Profile of the Running ES Score & Positions of GeneSet Members on the Rank Ordered List
| Dataset | Basophil.Basophil_Pheno.cls #Group2_versus_Group4.Basophil_Pheno.cls #Group2_versus_Group4_repos |
| Phenotype | Basophil_Pheno.cls#Group2_versus_Group4_repos |
| Upregulated in class | 1 |
| GeneSet | HALLMARK_ANGIOGENESIS |
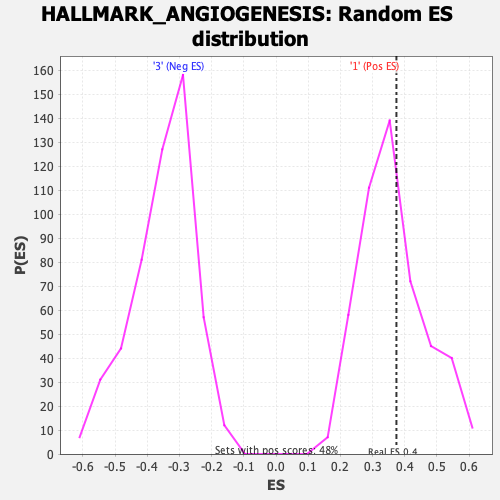
| Enrichment Score (ES) | 0.374356 |
| Normalized Enrichment Score (NES) | 1.0360051 |
| Nominal p-value | 0.3809524 |
| FDR q-value | 0.6600462 |
| FWER p-Value | 0.999 |
| SYMBOL | RANK IN GENE LIST | RANK METRIC SCORE | RUNNING ES | CORE ENRICHMENT | |
|---|---|---|---|---|---|
| 1 | Fstl1 | 4 | 1.240 | 0.1771 | Yes |
| 2 | Lrpap1 | 452 | 0.591 | 0.2348 | Yes |
| 3 | Pf4 | 686 | 0.531 | 0.2967 | Yes |
| 4 | Jag2 | 1039 | 0.468 | 0.3425 | Yes |
| 5 | Prg2 | 1483 | 0.409 | 0.3744 | Yes |
| 6 | Fgfr1 | 2370 | 0.326 | 0.3678 | No |
| 7 | App | 3834 | 0.214 | 0.3107 | No |
| 8 | Nrp1 | 5063 | 0.144 | 0.2576 | No |
| 9 | Olr1 | 6152 | 0.088 | 0.2050 | No |
| 10 | Lpl | 6520 | 0.070 | 0.1930 | No |
| 11 | Jag1 | 6883 | 0.050 | 0.1784 | No |
| 12 | Ptk2 | 9010 | -0.045 | 0.0573 | No |
| 13 | Vegfa | 9284 | -0.057 | 0.0491 | No |
| 14 | Tnfrsf21 | 10256 | -0.100 | 0.0051 | No |
| 15 | Ccnd2 | 11571 | -0.165 | -0.0502 | No |
| 16 | Apoh | 11948 | -0.184 | -0.0465 | No |
| 17 | Vcan | 12089 | -0.190 | -0.0277 | No |
| 18 | Vav2 | 12565 | -0.217 | -0.0251 | No |
| 19 | Spp1 | 12769 | -0.230 | -0.0045 | No |
| 20 | Pglyrp1 | 13623 | -0.283 | -0.0152 | No |
| 21 | Itgav | 13742 | -0.291 | 0.0194 | No |
| 22 | Slco2a1 | 13969 | -0.307 | 0.0497 | No |
| 23 | Thbd | 16565 | -0.797 | 0.0080 | No |