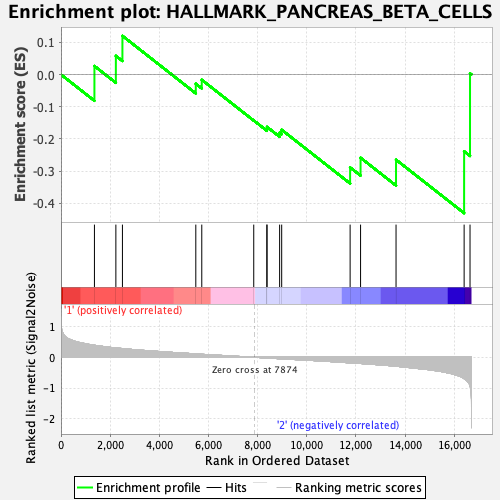
Profile of the Running ES Score & Positions of GeneSet Members on the Rank Ordered List
| Dataset | Basophil.Basophil_Pheno.cls #Group2_versus_Group3.Basophil_Pheno.cls #Group2_versus_Group3_repos |
| Phenotype | Basophil_Pheno.cls#Group2_versus_Group3_repos |
| Upregulated in class | 2 |
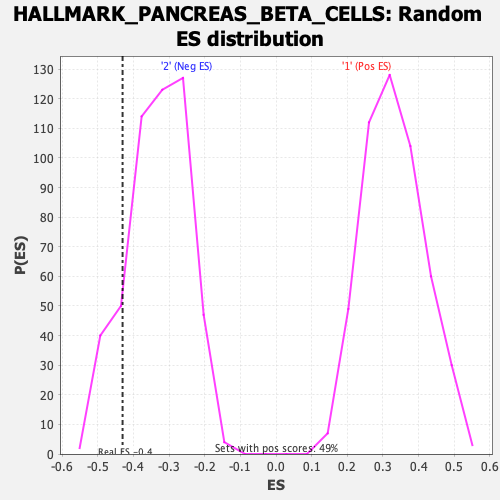
| GeneSet | HALLMARK_PANCREAS_BETA_CELLS |
| Enrichment Score (ES) | -0.43065107 |
| Normalized Enrichment Score (NES) | -1.296314 |
| Nominal p-value | 0.13609467 |
| FDR q-value | 1.0 |
| FWER p-Value | 0.824 |
| SYMBOL | RANK IN GENE LIST | RANK METRIC SCORE | RUNNING ES | CORE ENRICHMENT | |
|---|---|---|---|---|---|
| 1 | Dpp4 | 1360 | 0.390 | 0.0265 | No |
| 2 | Foxo1 | 2232 | 0.303 | 0.0581 | No |
| 3 | Akt3 | 2499 | 0.282 | 0.1201 | No |
| 4 | Srp14 | 5484 | 0.109 | -0.0286 | No |
| 5 | Pklr | 5727 | 0.096 | -0.0164 | No |
| 6 | Stxbp1 | 7841 | 0.001 | -0.1427 | No |
| 7 | Spcs1 | 8377 | -0.022 | -0.1686 | No |
| 8 | Pcsk2 | 8379 | -0.022 | -0.1626 | No |
| 9 | Sec11a | 8894 | -0.046 | -0.1806 | No |
| 10 | Srprb | 8978 | -0.050 | -0.1717 | No |
| 11 | Elp4 | 11762 | -0.180 | -0.2887 | Yes |
| 12 | Mafb | 12187 | -0.201 | -0.2586 | Yes |
| 13 | Pak3 | 13630 | -0.290 | -0.2647 | Yes |
| 14 | Lmo2 | 16400 | -0.693 | -0.2387 | Yes |
| 15 | Vdr | 16640 | -0.927 | 0.0035 | Yes |