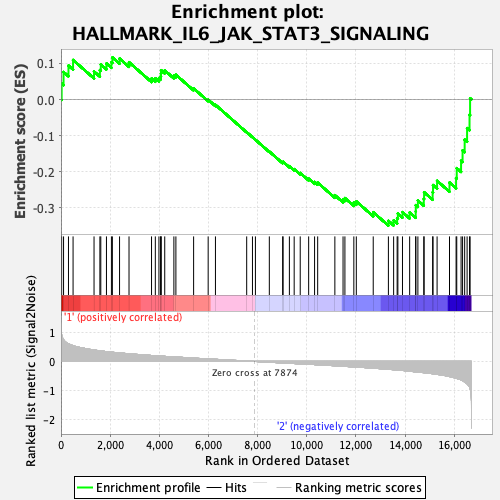
Profile of the Running ES Score & Positions of GeneSet Members on the Rank Ordered List
| Dataset | Basophil.Basophil_Pheno.cls #Group2_versus_Group3.Basophil_Pheno.cls #Group2_versus_Group3_repos |
| Phenotype | Basophil_Pheno.cls#Group2_versus_Group3_repos |
| Upregulated in class | 2 |
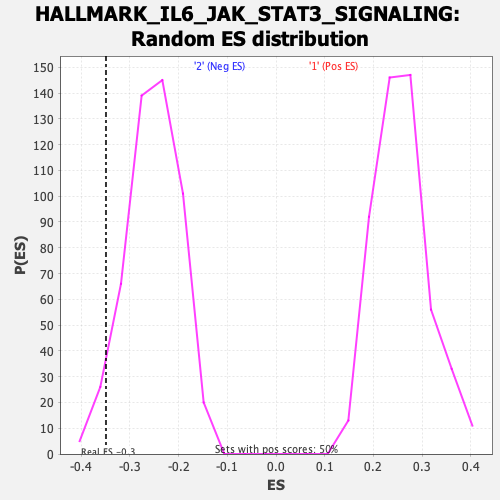
| GeneSet | HALLMARK_IL6_JAK_STAT3_SIGNALING |
| Enrichment Score (ES) | -0.34922245 |
| Normalized Enrichment Score (NES) | -1.3766894 |
| Nominal p-value | 0.037848607 |
| FDR q-value | 1.0 |
| FWER p-Value | 0.694 |
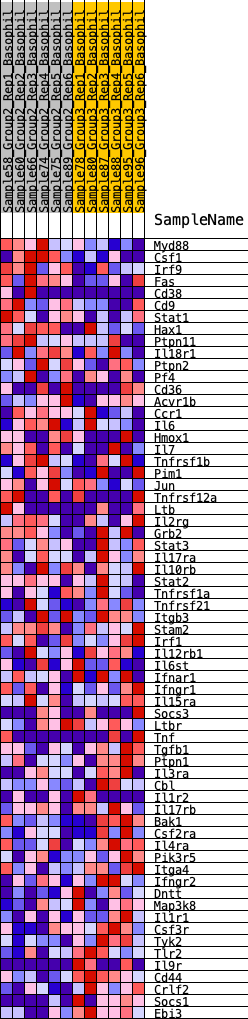
| SYMBOL | RANK IN GENE LIST | RANK METRIC SCORE | RUNNING ES | CORE ENRICHMENT | |
|---|---|---|---|---|---|
| 1 | Myd88 | 27 | 0.925 | 0.0440 | No |
| 2 | Csf1 | 104 | 0.743 | 0.0761 | No |
| 3 | Irf9 | 304 | 0.604 | 0.0939 | No |
| 4 | Fas | 491 | 0.540 | 0.1094 | No |
| 5 | Cd38 | 1344 | 0.392 | 0.0776 | No |
| 6 | Cd9 | 1582 | 0.364 | 0.0813 | No |
| 7 | Stat1 | 1619 | 0.362 | 0.0970 | No |
| 8 | Hax1 | 1849 | 0.334 | 0.0997 | No |
| 9 | Ptpn11 | 2051 | 0.318 | 0.1033 | No |
| 10 | Il18r1 | 2090 | 0.314 | 0.1165 | No |
| 11 | Ptpn2 | 2382 | 0.291 | 0.1134 | No |
| 12 | Pf4 | 2767 | 0.262 | 0.1032 | No |
| 13 | Cd36 | 3683 | 0.203 | 0.0582 | No |
| 14 | Acvr1b | 3837 | 0.196 | 0.0587 | No |
| 15 | Ccr1 | 3984 | 0.187 | 0.0591 | No |
| 16 | Il6 | 4054 | 0.182 | 0.0640 | No |
| 17 | Hmox1 | 4066 | 0.182 | 0.0723 | No |
| 18 | Il7 | 4072 | 0.181 | 0.0809 | No |
| 19 | Tnfrsf1b | 4220 | 0.173 | 0.0806 | No |
| 20 | Pim1 | 4592 | 0.154 | 0.0659 | No |
| 21 | Jun | 4674 | 0.151 | 0.0685 | No |
| 22 | Tnfrsf12a | 5395 | 0.113 | 0.0308 | No |
| 23 | Ltb | 5987 | 0.084 | -0.0006 | No |
| 24 | Il2rg | 6283 | 0.072 | -0.0148 | No |
| 25 | Grb2 | 7554 | 0.014 | -0.0904 | No |
| 26 | Stat3 | 7789 | 0.003 | -0.1043 | No |
| 27 | Il17ra | 7909 | -0.000 | -0.1115 | No |
| 28 | Il10rb | 8475 | -0.026 | -0.1441 | No |
| 29 | Stat2 | 9017 | -0.052 | -0.1741 | No |
| 30 | Tnfrsf1a | 9035 | -0.053 | -0.1725 | No |
| 31 | Tnfrsf21 | 9291 | -0.064 | -0.1847 | No |
| 32 | Itgb3 | 9486 | -0.071 | -0.1928 | No |
| 33 | Stam2 | 9732 | -0.083 | -0.2035 | No |
| 34 | Irf1 | 10075 | -0.097 | -0.2192 | No |
| 35 | Il12rb1 | 10316 | -0.107 | -0.2284 | No |
| 36 | Il6st | 10442 | -0.113 | -0.2303 | No |
| 37 | Ifnar1 | 11141 | -0.147 | -0.2650 | No |
| 38 | Ifngr1 | 11474 | -0.164 | -0.2769 | No |
| 39 | Il15ra | 11550 | -0.168 | -0.2731 | No |
| 40 | Socs3 | 11913 | -0.186 | -0.2856 | No |
| 41 | Ltbr | 12014 | -0.192 | -0.2822 | No |
| 42 | Tnf | 12702 | -0.229 | -0.3122 | No |
| 43 | Tgfb1 | 13319 | -0.267 | -0.3360 | Yes |
| 44 | Ptpn1 | 13532 | -0.283 | -0.3348 | Yes |
| 45 | Il3ra | 13675 | -0.293 | -0.3289 | Yes |
| 46 | Cbl | 13705 | -0.296 | -0.3160 | Yes |
| 47 | Il1r2 | 13892 | -0.310 | -0.3119 | Yes |
| 48 | Il17rb | 14184 | -0.335 | -0.3129 | Yes |
| 49 | Bak1 | 14430 | -0.355 | -0.3101 | Yes |
| 50 | Csf2ra | 14434 | -0.356 | -0.2927 | Yes |
| 51 | Il4ra | 14519 | -0.364 | -0.2798 | Yes |
| 52 | Pik3r5 | 14759 | -0.384 | -0.2752 | Yes |
| 53 | Itga4 | 14772 | -0.385 | -0.2569 | Yes |
| 54 | Ifngr2 | 15119 | -0.420 | -0.2570 | Yes |
| 55 | Dntt | 15135 | -0.422 | -0.2370 | Yes |
| 56 | Map3k8 | 15300 | -0.440 | -0.2251 | Yes |
| 57 | Il1r1 | 15805 | -0.518 | -0.2299 | Yes |
| 58 | Csf3r | 16073 | -0.578 | -0.2174 | Yes |
| 59 | Tyk2 | 16100 | -0.584 | -0.1902 | Yes |
| 60 | Tlr2 | 16276 | -0.633 | -0.1695 | Yes |
| 61 | Il9r | 16337 | -0.653 | -0.1409 | Yes |
| 62 | Cd44 | 16422 | -0.703 | -0.1113 | Yes |
| 63 | Crlf2 | 16521 | -0.767 | -0.0793 | Yes |
| 64 | Socs1 | 16620 | -0.870 | -0.0423 | Yes |
| 65 | Ebi3 | 16643 | -0.952 | 0.0034 | Yes |