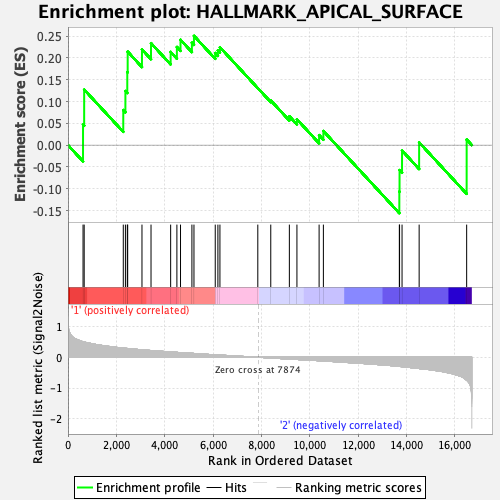
Profile of the Running ES Score & Positions of GeneSet Members on the Rank Ordered List
| Dataset | Basophil.Basophil_Pheno.cls #Group2_versus_Group3.Basophil_Pheno.cls #Group2_versus_Group3_repos |
| Phenotype | Basophil_Pheno.cls#Group2_versus_Group3_repos |
| Upregulated in class | 1 |
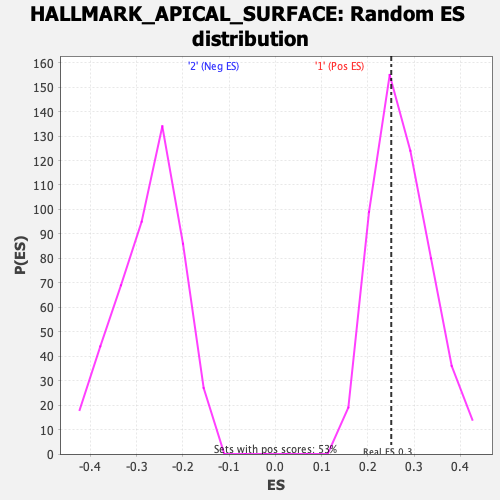
| GeneSet | HALLMARK_APICAL_SURFACE |
| Enrichment Score (ES) | 0.25053647 |
| Normalized Enrichment Score (NES) | 0.91513276 |
| Nominal p-value | 0.61669827 |
| FDR q-value | 0.8369127 |
| FWER p-Value | 1.0 |
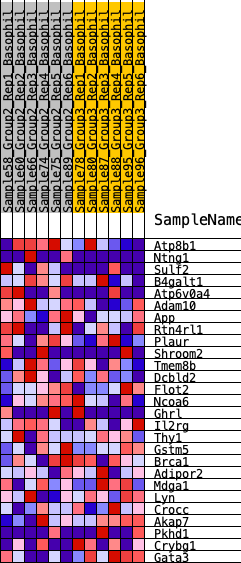
| SYMBOL | RANK IN GENE LIST | RANK METRIC SCORE | RUNNING ES | CORE ENRICHMENT | |
|---|---|---|---|---|---|
| 1 | Atp8b1 | 622 | 0.504 | 0.0471 | Yes |
| 2 | Ntng1 | 669 | 0.495 | 0.1273 | Yes |
| 3 | Sulf2 | 2286 | 0.299 | 0.0804 | Yes |
| 4 | B4galt1 | 2374 | 0.291 | 0.1240 | Yes |
| 5 | Atp6v0a4 | 2452 | 0.287 | 0.1674 | Yes |
| 6 | Adam10 | 2468 | 0.285 | 0.2143 | Yes |
| 7 | App | 3059 | 0.241 | 0.2194 | Yes |
| 8 | Rtn4rl1 | 3433 | 0.219 | 0.2337 | Yes |
| 9 | Plaur | 4245 | 0.171 | 0.2137 | Yes |
| 10 | Shroom2 | 4503 | 0.160 | 0.2250 | Yes |
| 11 | Tmem8b | 4653 | 0.152 | 0.2415 | Yes |
| 12 | Dcbld2 | 5124 | 0.128 | 0.2348 | Yes |
| 13 | Flot2 | 5209 | 0.124 | 0.2505 | Yes |
| 14 | Ncoa6 | 6089 | 0.080 | 0.2112 | No |
| 15 | Ghrl | 6199 | 0.076 | 0.2174 | No |
| 16 | Il2rg | 6283 | 0.072 | 0.2244 | No |
| 17 | Thy1 | 7849 | 0.001 | 0.1307 | No |
| 18 | Gstm5 | 8385 | -0.022 | 0.1024 | No |
| 19 | Brca1 | 9154 | -0.058 | 0.0661 | No |
| 20 | Adipor2 | 9467 | -0.070 | 0.0592 | No |
| 21 | Mdga1 | 10384 | -0.111 | 0.0229 | No |
| 22 | Lyn | 10561 | -0.120 | 0.0324 | No |
| 23 | Crocc | 13702 | -0.296 | -0.1064 | No |
| 24 | Akap7 | 13711 | -0.296 | -0.0573 | No |
| 25 | Pkhd1 | 13814 | -0.304 | -0.0125 | No |
| 26 | Crybg1 | 14521 | -0.364 | 0.0062 | No |
| 27 | Gata3 | 16486 | -0.743 | 0.0128 | No |