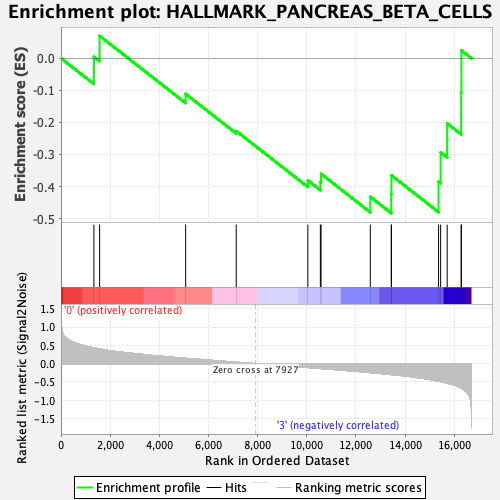
Profile of the Running ES Score & Positions of GeneSet Members on the Rank Ordered List
| Dataset | Basophil.Basophil_Pheno.cls #Group1_versus_Group4.Basophil_Pheno.cls #Group1_versus_Group4_repos |
| Phenotype | Basophil_Pheno.cls#Group1_versus_Group4_repos |
| Upregulated in class | 3 |
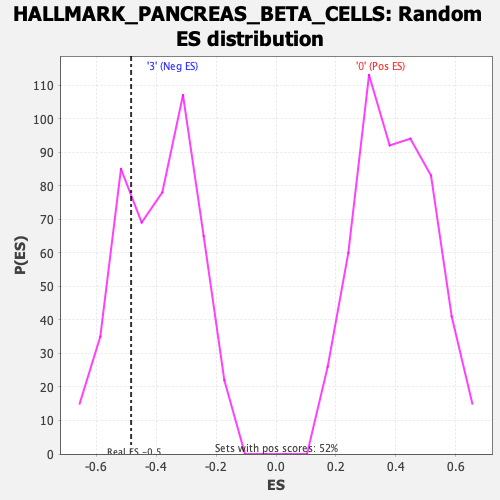
| GeneSet | HALLMARK_PANCREAS_BETA_CELLS |
| Enrichment Score (ES) | -0.4831024 |
| Normalized Enrichment Score (NES) | -1.2343241 |
| Nominal p-value | 0.26890758 |
| FDR q-value | 0.45087513 |
| FWER p-Value | 0.939 |
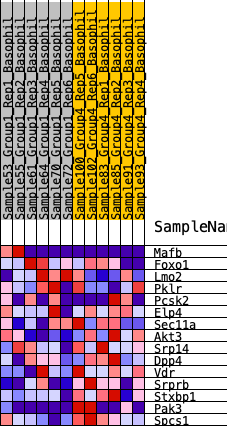
| SYMBOL | RANK IN GENE LIST | RANK METRIC SCORE | RUNNING ES | CORE ENRICHMENT | |
|---|---|---|---|---|---|
| 1 | Mafb | 1339 | 0.427 | 0.0046 | No |
| 2 | Foxo1 | 1571 | 0.399 | 0.0699 | No |
| 3 | Lmo2 | 5071 | 0.144 | -0.1111 | No |
| 4 | Pklr | 7129 | 0.038 | -0.2270 | No |
| 5 | Pcsk2 | 10042 | -0.104 | -0.3809 | No |
| 6 | Elp4 | 10551 | -0.132 | -0.3852 | No |
| 7 | Sec11a | 10579 | -0.133 | -0.3604 | No |
| 8 | Akt3 | 12583 | -0.244 | -0.4321 | Yes |
| 9 | Srp14 | 13435 | -0.298 | -0.4240 | Yes |
| 10 | Dpp4 | 13444 | -0.298 | -0.3653 | Yes |
| 11 | Vdr | 15360 | -0.478 | -0.3851 | Yes |
| 12 | Srprb | 15444 | -0.487 | -0.2933 | Yes |
| 13 | Stxbp1 | 15710 | -0.534 | -0.2033 | Yes |
| 14 | Pak3 | 16279 | -0.659 | -0.1064 | Yes |
| 15 | Spcs1 | 16289 | -0.663 | 0.0246 | Yes |