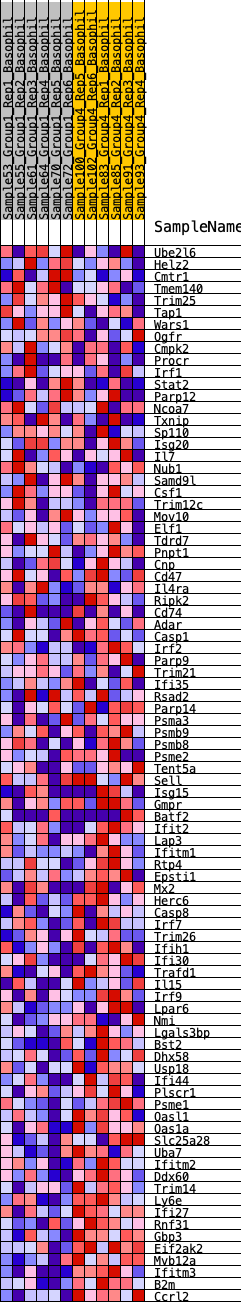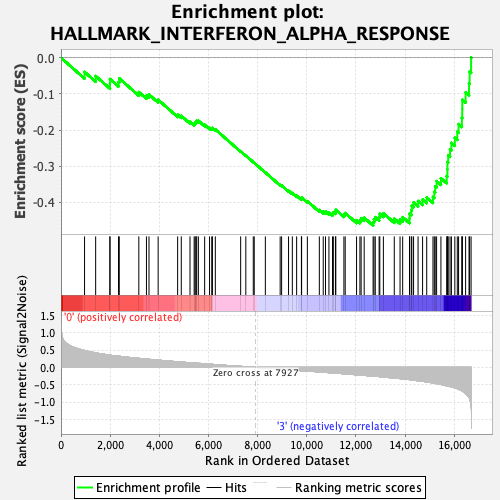
Profile of the Running ES Score & Positions of GeneSet Members on the Rank Ordered List
| Dataset | Basophil.Basophil_Pheno.cls #Group1_versus_Group4.Basophil_Pheno.cls #Group1_versus_Group4_repos |
| Phenotype | Basophil_Pheno.cls#Group1_versus_Group4_repos |
| Upregulated in class | 3 |
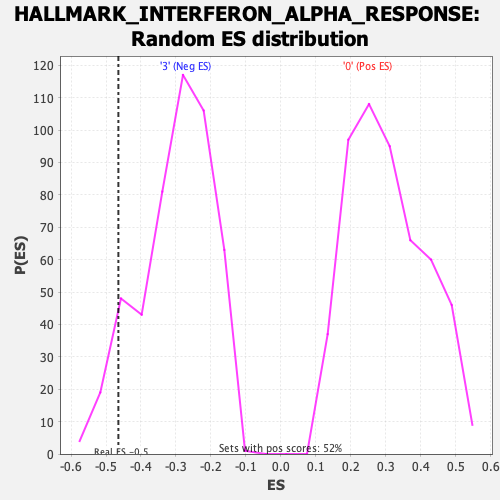
| GeneSet | HALLMARK_INTERFERON_ALPHA_RESPONSE |
| Enrichment Score (ES) | -0.46461013 |
| Normalized Enrichment Score (NES) | -1.5440428 |
| Nominal p-value | 0.082987554 |
| FDR q-value | 0.21574435 |
| FWER p-Value | 0.31 |
| SYMBOL | RANK IN GENE LIST | RANK METRIC SCORE | RUNNING ES | CORE ENRICHMENT | |
|---|---|---|---|---|---|
| 1 | Ube2l6 | 958 | 0.487 | -0.0392 | No |
| 2 | Helz2 | 1410 | 0.418 | -0.0506 | No |
| 3 | Cmtr1 | 1990 | 0.352 | -0.0721 | No |
| 4 | Tmem140 | 1992 | 0.352 | -0.0588 | No |
| 5 | Trim25 | 2340 | 0.323 | -0.0675 | No |
| 6 | Tap1 | 2370 | 0.320 | -0.0571 | No |
| 7 | Wars1 | 3166 | 0.261 | -0.0950 | No |
| 8 | Ogfr | 3476 | 0.241 | -0.1045 | No |
| 9 | Cmpk2 | 3580 | 0.235 | -0.1018 | No |
| 10 | Procr | 3952 | 0.209 | -0.1162 | No |
| 11 | Irf1 | 4745 | 0.162 | -0.1577 | No |
| 12 | Stat2 | 4893 | 0.154 | -0.1608 | No |
| 13 | Parp12 | 5248 | 0.134 | -0.1770 | No |
| 14 | Ncoa7 | 5417 | 0.125 | -0.1823 | No |
| 15 | Txnip | 5455 | 0.123 | -0.1799 | No |
| 16 | Sp110 | 5490 | 0.121 | -0.1774 | No |
| 17 | Isg20 | 5520 | 0.119 | -0.1746 | No |
| 18 | Il7 | 5588 | 0.116 | -0.1742 | No |
| 19 | Nub1 | 5844 | 0.105 | -0.1856 | No |
| 20 | Samd9l | 6043 | 0.094 | -0.1940 | No |
| 21 | Csf1 | 6134 | 0.089 | -0.1960 | No |
| 22 | Trim12c | 6160 | 0.087 | -0.1942 | No |
| 23 | Mov10 | 6278 | 0.082 | -0.1982 | No |
| 24 | Elf1 | 7309 | 0.030 | -0.2590 | No |
| 25 | Tdrd7 | 7519 | 0.020 | -0.2708 | No |
| 26 | Pnpt1 | 7822 | 0.005 | -0.2888 | No |
| 27 | Cnp | 7861 | 0.003 | -0.2910 | No |
| 28 | Cd47 | 8313 | -0.017 | -0.3175 | No |
| 29 | Il4ra | 8916 | -0.046 | -0.3520 | No |
| 30 | Ripk2 | 8975 | -0.050 | -0.3536 | No |
| 31 | Cd74 | 9257 | -0.064 | -0.3681 | No |
| 32 | Adar | 9411 | -0.074 | -0.3745 | No |
| 33 | Casp1 | 9586 | -0.082 | -0.3819 | No |
| 34 | Irf2 | 9780 | -0.092 | -0.3900 | No |
| 35 | Parp9 | 9789 | -0.093 | -0.3870 | No |
| 36 | Trim21 | 10022 | -0.103 | -0.3970 | No |
| 37 | Ifi35 | 10509 | -0.129 | -0.4214 | No |
| 38 | Rsad2 | 10668 | -0.138 | -0.4257 | No |
| 39 | Parp14 | 10760 | -0.142 | -0.4258 | No |
| 40 | Psma3 | 10900 | -0.150 | -0.4285 | No |
| 41 | Psmb9 | 11045 | -0.155 | -0.4313 | No |
| 42 | Psmb8 | 11079 | -0.157 | -0.4273 | No |
| 43 | Psme2 | 11164 | -0.162 | -0.4262 | No |
| 44 | Tent5a | 11180 | -0.163 | -0.4209 | No |
| 45 | Sell | 11509 | -0.182 | -0.4338 | No |
| 46 | Isg15 | 11562 | -0.185 | -0.4299 | No |
| 47 | Gmpr | 12024 | -0.211 | -0.4497 | No |
| 48 | Batf2 | 12161 | -0.218 | -0.4496 | No |
| 49 | Ifit2 | 12210 | -0.222 | -0.4441 | No |
| 50 | Lap3 | 12334 | -0.229 | -0.4428 | No |
| 51 | Ifitm1 | 12697 | -0.249 | -0.4552 | Yes |
| 52 | Rtp4 | 12733 | -0.251 | -0.4478 | Yes |
| 53 | Epsti1 | 12785 | -0.255 | -0.4412 | Yes |
| 54 | Mx2 | 12942 | -0.263 | -0.4406 | Yes |
| 55 | Herc6 | 12970 | -0.265 | -0.4322 | Yes |
| 56 | Casp8 | 13115 | -0.275 | -0.4304 | Yes |
| 57 | Irf7 | 13558 | -0.307 | -0.4454 | Yes |
| 58 | Trim26 | 13793 | -0.321 | -0.4473 | Yes |
| 59 | Ifih1 | 13900 | -0.330 | -0.4412 | Yes |
| 60 | Ifi30 | 14178 | -0.350 | -0.4446 | Yes |
| 61 | Trafd1 | 14181 | -0.350 | -0.4315 | Yes |
| 62 | Il15 | 14250 | -0.356 | -0.4221 | Yes |
| 63 | Irf9 | 14272 | -0.358 | -0.4098 | Yes |
| 64 | Lpar6 | 14343 | -0.364 | -0.4002 | Yes |
| 65 | Nmi | 14526 | -0.385 | -0.3966 | Yes |
| 66 | Lgals3bp | 14710 | -0.400 | -0.3924 | Yes |
| 67 | Bst2 | 14878 | -0.416 | -0.3867 | Yes |
| 68 | Dhx58 | 15133 | -0.447 | -0.3851 | Yes |
| 69 | Usp18 | 15186 | -0.454 | -0.3710 | Yes |
| 70 | Ifi44 | 15223 | -0.460 | -0.3558 | Yes |
| 71 | Plscr1 | 15280 | -0.467 | -0.3415 | Yes |
| 72 | Psme1 | 15456 | -0.488 | -0.3335 | Yes |
| 73 | Oasl1 | 15691 | -0.530 | -0.3275 | Yes |
| 74 | Oas1a | 15719 | -0.535 | -0.3089 | Yes |
| 75 | Slc25a28 | 15722 | -0.535 | -0.2887 | Yes |
| 76 | Uba7 | 15753 | -0.541 | -0.2700 | Yes |
| 77 | Ifitm2 | 15827 | -0.552 | -0.2535 | Yes |
| 78 | Ddx60 | 15883 | -0.561 | -0.2356 | Yes |
| 79 | Trim14 | 16022 | -0.589 | -0.2216 | Yes |
| 80 | Ly6e | 16122 | -0.611 | -0.2044 | Yes |
| 81 | Ifi27 | 16174 | -0.629 | -0.1837 | Yes |
| 82 | Rnf31 | 16309 | -0.669 | -0.1664 | Yes |
| 83 | Gbp3 | 16324 | -0.675 | -0.1417 | Yes |
| 84 | Eif2ak2 | 16325 | -0.675 | -0.1161 | Yes |
| 85 | Mvb12a | 16460 | -0.754 | -0.0956 | Yes |
| 86 | Ifitm3 | 16600 | -0.862 | -0.0714 | Yes |
| 87 | B2m | 16623 | -0.905 | -0.0384 | Yes |
| 88 | Ccrl2 | 16683 | -1.133 | 0.0010 | Yes |