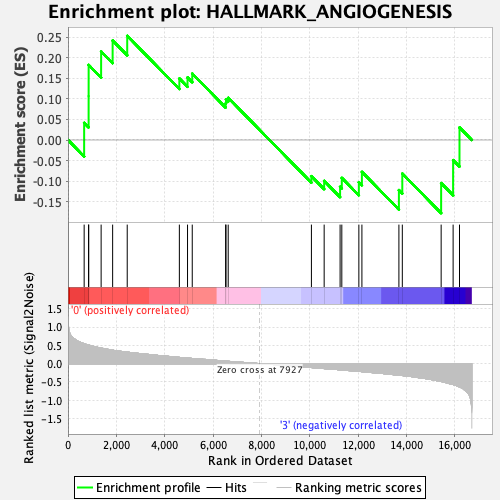
Profile of the Running ES Score & Positions of GeneSet Members on the Rank Ordered List
| Dataset | Basophil.Basophil_Pheno.cls #Group1_versus_Group4.Basophil_Pheno.cls #Group1_versus_Group4_repos |
| Phenotype | Basophil_Pheno.cls#Group1_versus_Group4_repos |
| Upregulated in class | 0 |
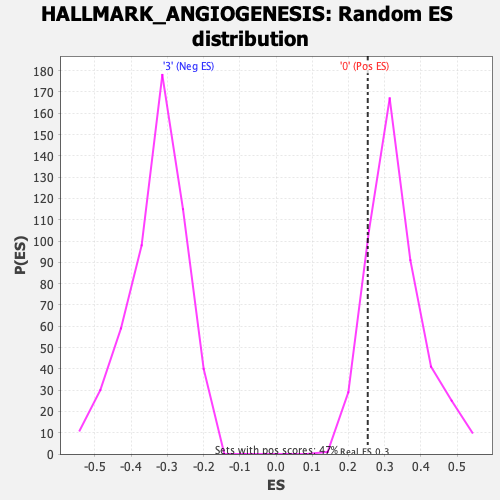
| GeneSet | HALLMARK_ANGIOGENESIS |
| Enrichment Score (ES) | 0.25318426 |
| Normalized Enrichment Score (NES) | 0.77086943 |
| Nominal p-value | 0.86567163 |
| FDR q-value | 0.899206 |
| FWER p-Value | 1.0 |
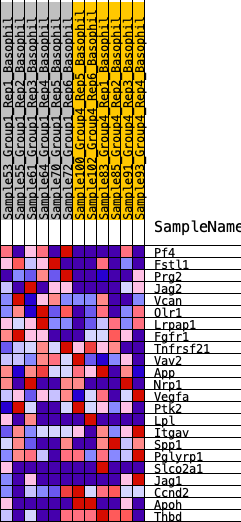
| SYMBOL | RANK IN GENE LIST | RANK METRIC SCORE | RUNNING ES | CORE ENRICHMENT | |
|---|---|---|---|---|---|
| 1 | Pf4 | 668 | 0.543 | 0.0416 | Yes |
| 2 | Fstl1 | 853 | 0.505 | 0.1066 | Yes |
| 3 | Prg2 | 854 | 0.505 | 0.1825 | Yes |
| 4 | Jag2 | 1370 | 0.424 | 0.2153 | Yes |
| 5 | Vcan | 1846 | 0.367 | 0.2420 | Yes |
| 6 | Olr1 | 2449 | 0.315 | 0.2532 | Yes |
| 7 | Lrpap1 | 4605 | 0.170 | 0.1496 | No |
| 8 | Fgfr1 | 4943 | 0.152 | 0.1521 | No |
| 9 | Tnfrsf21 | 5138 | 0.140 | 0.1615 | No |
| 10 | Vav2 | 6519 | 0.069 | 0.0891 | No |
| 11 | App | 6533 | 0.068 | 0.0986 | No |
| 12 | Nrp1 | 6625 | 0.063 | 0.1025 | No |
| 13 | Vegfa | 10066 | -0.105 | -0.0879 | No |
| 14 | Ptk2 | 10593 | -0.133 | -0.0994 | No |
| 15 | Lpl | 11252 | -0.167 | -0.1137 | No |
| 16 | Itgav | 11323 | -0.171 | -0.0922 | No |
| 17 | Spp1 | 12028 | -0.211 | -0.1027 | No |
| 18 | Pglyrp1 | 12154 | -0.217 | -0.0775 | No |
| 19 | Slco2a1 | 13684 | -0.315 | -0.1218 | No |
| 20 | Jag1 | 13825 | -0.323 | -0.0816 | No |
| 21 | Ccnd2 | 15431 | -0.486 | -0.1048 | No |
| 22 | Apoh | 15926 | -0.569 | -0.0489 | No |
| 23 | Thbd | 16190 | -0.633 | 0.0305 | No |