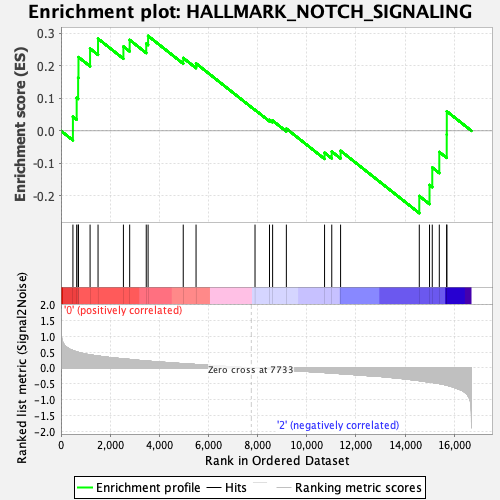
Profile of the Running ES Score & Positions of GeneSet Members on the Rank Ordered List
| Dataset | Basophil.Basophil_Pheno.cls #Group1_versus_Group3.Basophil_Pheno.cls #Group1_versus_Group3_repos |
| Phenotype | Basophil_Pheno.cls#Group1_versus_Group3_repos |
| Upregulated in class | 0 |
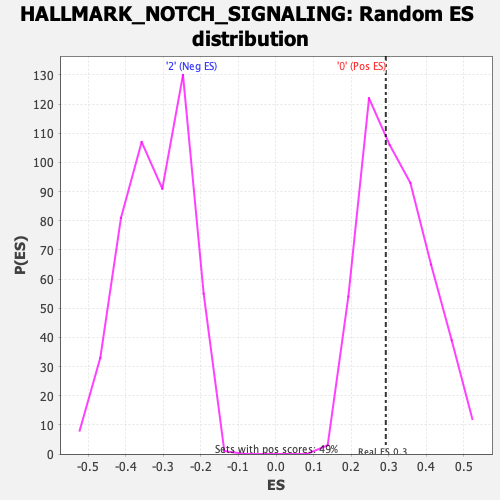
| GeneSet | HALLMARK_NOTCH_SIGNALING |
| Enrichment Score (ES) | 0.29246357 |
| Normalized Enrichment Score (NES) | 0.9143846 |
| Nominal p-value | 0.55870444 |
| FDR q-value | 0.71252334 |
| FWER p-Value | 0.999 |
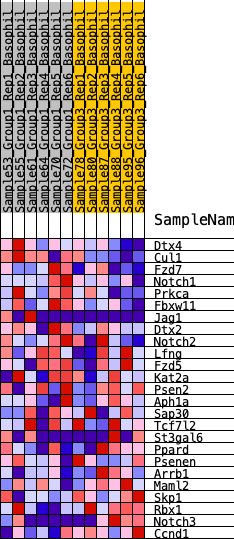
| SYMBOL | RANK IN GENE LIST | RANK METRIC SCORE | RUNNING ES | CORE ENRICHMENT | |
|---|---|---|---|---|---|
| 1 | Dtx4 | 485 | 0.551 | 0.0437 | Yes |
| 2 | Cul1 | 638 | 0.507 | 0.1016 | Yes |
| 3 | Fzd7 | 697 | 0.493 | 0.1634 | Yes |
| 4 | Notch1 | 711 | 0.488 | 0.2270 | Yes |
| 5 | Prkca | 1183 | 0.413 | 0.2534 | Yes |
| 6 | Fbxw11 | 1507 | 0.377 | 0.2839 | Yes |
| 7 | Jag1 | 2539 | 0.285 | 0.2597 | Yes |
| 8 | Dtx2 | 2794 | 0.268 | 0.2800 | Yes |
| 9 | Notch2 | 3468 | 0.219 | 0.2686 | Yes |
| 10 | Lfng | 3543 | 0.214 | 0.2925 | Yes |
| 11 | Fzd5 | 4973 | 0.134 | 0.2244 | No |
| 12 | Kat2a | 5494 | 0.109 | 0.2077 | No |
| 13 | Psen2 | 7893 | -0.006 | 0.0646 | No |
| 14 | Aph1a | 8482 | -0.034 | 0.0338 | No |
| 15 | Sap30 | 8609 | -0.040 | 0.0316 | No |
| 16 | Tcf7l2 | 9168 | -0.066 | 0.0068 | No |
| 17 | St3gal6 | 10722 | -0.144 | -0.0673 | No |
| 18 | Ppard | 11015 | -0.161 | -0.0636 | No |
| 19 | Psenen | 11374 | -0.179 | -0.0614 | No |
| 20 | Arrb1 | 14576 | -0.400 | -0.2005 | No |
| 21 | Maml2 | 14992 | -0.445 | -0.1666 | No |
| 22 | Skp1 | 15104 | -0.457 | -0.1129 | No |
| 23 | Rbx1 | 15390 | -0.491 | -0.0650 | No |
| 24 | Notch3 | 15692 | -0.542 | -0.0114 | No |
| 25 | Ccnd1 | 15695 | -0.543 | 0.0602 | No |