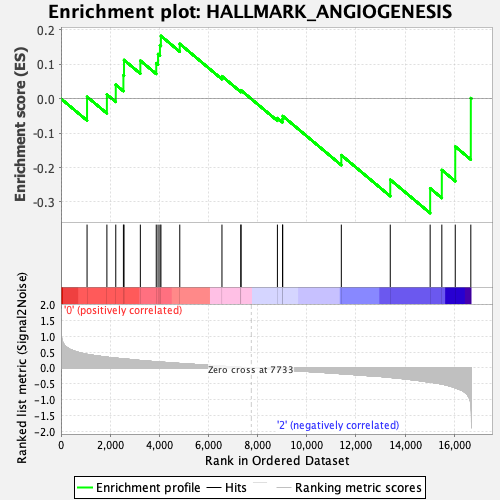
Profile of the Running ES Score & Positions of GeneSet Members on the Rank Ordered List
| Dataset | Basophil.Basophil_Pheno.cls #Group1_versus_Group3.Basophil_Pheno.cls #Group1_versus_Group3_repos |
| Phenotype | Basophil_Pheno.cls#Group1_versus_Group3_repos |
| Upregulated in class | 2 |
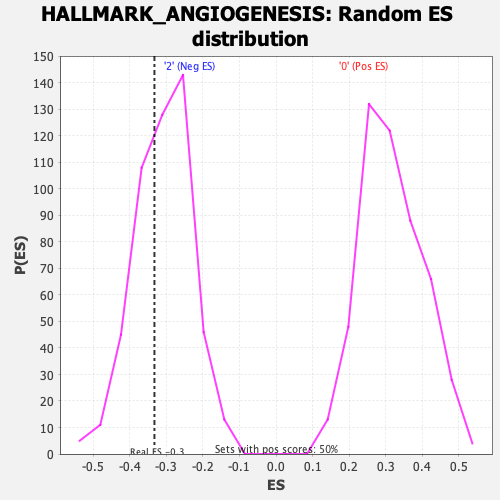
| GeneSet | HALLMARK_ANGIOGENESIS |
| Enrichment Score (ES) | -0.3326703 |
| Normalized Enrichment Score (NES) | -1.0737046 |
| Nominal p-value | 0.3567134 |
| FDR q-value | 0.9705002 |
| FWER p-Value | 0.994 |
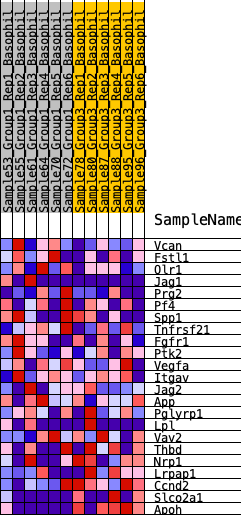
| SYMBOL | RANK IN GENE LIST | RANK METRIC SCORE | RUNNING ES | CORE ENRICHMENT | |
|---|---|---|---|---|---|
| 1 | Vcan | 1060 | 0.429 | 0.0056 | No |
| 2 | Fstl1 | 1867 | 0.340 | 0.0122 | No |
| 3 | Olr1 | 2228 | 0.310 | 0.0405 | No |
| 4 | Jag1 | 2539 | 0.285 | 0.0680 | No |
| 5 | Prg2 | 2564 | 0.285 | 0.1125 | No |
| 6 | Pf4 | 3228 | 0.235 | 0.1106 | No |
| 7 | Spp1 | 3875 | 0.195 | 0.1033 | No |
| 8 | Tnfrsf21 | 3948 | 0.191 | 0.1297 | No |
| 9 | Fgfr1 | 4026 | 0.186 | 0.1551 | No |
| 10 | Ptk2 | 4065 | 0.184 | 0.1825 | No |
| 11 | Vegfa | 4832 | 0.141 | 0.1594 | No |
| 12 | Itgav | 6548 | 0.055 | 0.0653 | No |
| 13 | Jag2 | 7319 | 0.017 | 0.0219 | No |
| 14 | App | 7321 | 0.017 | 0.0245 | No |
| 15 | Pglyrp1 | 8804 | -0.049 | -0.0564 | No |
| 16 | Lpl | 9011 | -0.059 | -0.0593 | No |
| 17 | Vav2 | 9021 | -0.059 | -0.0504 | No |
| 18 | Thbd | 11404 | -0.181 | -0.1641 | No |
| 19 | Nrp1 | 13395 | -0.298 | -0.2354 | No |
| 20 | Lrpap1 | 15018 | -0.448 | -0.2604 | Yes |
| 21 | Ccnd2 | 15493 | -0.506 | -0.2072 | Yes |
| 22 | Slco2a1 | 16039 | -0.625 | -0.1391 | Yes |
| 23 | Apoh | 16672 | -1.107 | 0.0016 | Yes |